15.09.2022 - Studies
There are many gimmicks on Wall Street - one of the most popular has the following rule: If you can't reach your goals, set the bar so low that you can easily jump it later.
Old hands on the US stock market know the game inside out. The largest US retailer Walmart, for example, increased its revenues significantly in its second quarter, which runs until the end of July, but had to accept a seven percent drop in profits. This is a regular source of bitterness for stock market players.
However, Walmart had only lowered its profit targets in July, warning that the rising prices of much-needed goods such as groceries and petrol could significantly dampen customers' willingness to spend on other products.
Only a few weeks later it became clear that this was too pessimistic. Now there will be a not-so-substantial decline in profits in the current business year, the company, which has been listed on the stock exchange for 52 years, said when it presented its quarterly figures. Wall Street reacted promptly, the share price climbed by six percent after the announcement.
Nevertheless, the Walmart Group, which is listed in the Dow Jones Industrial Average, will probably have to accept a more or less strong erosion of its profit margins in the current financial year in the combination of rising sales and declining profits. So inflation is casting its shadow.
But does Walmart exemplify the large listed companies, or is the largest US retailer rather an exception due to its business model? Is it alone with the problem of not being able to fully pass on the increased prices to customers?
Now that companies around the globe have already reported on two quarters this year, a look at the development of profit margins can provide information or at least first valuable indications. Two quarters does not always mean that companies disclosed their latest business development as of 31 March and 30 June (this traditionally applies to European companies), but also sometimes as of the end of February/end of May or end of January/end of April, when some US companies disclosed their last two quarterly reports.
The relevance that the price increases have for the business of many companies is obvious. Producer prices of industrial products in Germany, for example, were 37.2 percent higher in July 2022 than in July 2021, the highest year-on-year increase since the survey began in 1949. Due to a different statistical survey method, producer prices in the USA are also increasing at a much slower rate, but nevertheless at a rapid pace (Chart 1).
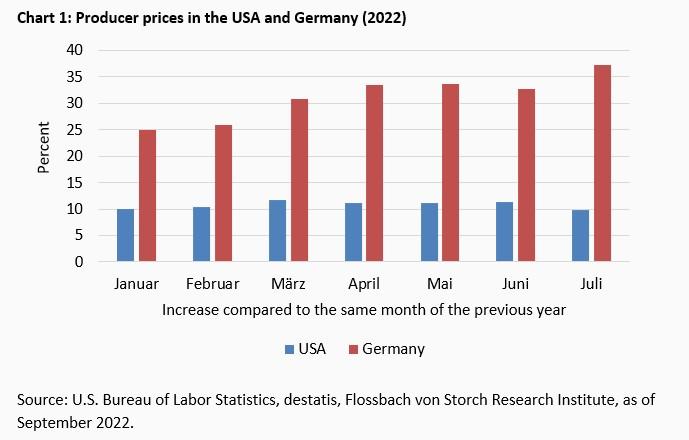
In most cases, it should be challenging to pass on these high rates to customers - at least that is the intuition of investors, who tend to sell stocks this year amid news of rising price levels for goods and services.
Intuition is one thing, a look at the figures is another. From the company's point of view, profit margins provide information on the extent to which the leap over the inflation hurdle may be successful. If these are at least stable, then the price pass-through has worked.
The key indicator here is earnings before interest, taxes and depreciation on balance sheet assets (Ebitda) and the turnover margin measured against it, i.e. the Ebitda margin.
Other profit ratios, such as net income, are undoubtedly relevant in the stock market context, but the inflation effect is more difficult to read here. Depreciation or net interest income, which are important in net profit, are therefore at most indirectly influenced by consumer prices.
Theoretically, the gross margin could also be used as a yardstick. However, this is only relevant in a very narrow context, for example for companies in the chip industry. For other IT companies, however, the comparison could be less relevant, as hardly any physical goods are used there.
Within the regularly heterogeneous composition even of sector indices, the Ebitda margin therefore comes into question for a good result. For example, no gross results or margins are available for the credit card provider Visa, which is part of the S&P 500 IT sector - in this case they should be almost identical to the Ebitda margin.
To measure the effects on individual sectors, sub-indices of the large S&P 500 and Stoxx 600 indices are suitable. The American S&P 500 has eleven sectors. Isolated from these were the financial sector, whose results have little to do with inflation, and the real estate sector, as this is of little relevance in this context.
In the Stoxx 600 with its 19 sectors, 14 ultimately fall into the selection. Banks, financial services, insurance, real estate and retail are isolated; the latter because the data basis is still too spotty for a good half of the companies in 2022.
In addition, past time series and the composition of the individual sub-indices could not be adopted uncritically. Distortions that occurred in individual companies or even in entire sectors during the Corona pandemic should be excluded for a valid database.
For example, data from the S&P 500 energy sector for the first half of 2020 are excluded due to losses and strongly negative margins. This applies to the overall view.
Cruise companies listed in the "Consumer Discretionary" sector (non-basic consumption) are not taken into account at all at sector level. Extremely negative margins in the past would have diluted the average of the sector strongly downwards. The bar for comparing margins would therefore be too low due to the special situation of a few companies.
In the Stoxx 600 Automobiles & Parts, for example, data on Porsche Holding was not included because it is an investment company with no operating business. In the end, 381 companies from 9 sectors of the S&P 500 and 411 groups from 14 sectors of the Stoxx 600 remained.
In Europe, many companies only provide information on a half-yearly basis, for example British groups. Therefore, in contrast to the S&P 500 sectors, the first half of 2022 was compared with the years 2017 to 2021. In the S&P 500, on the other hand, the last reporting quarter was examined together with the 20 previous quarters.
For all sub-indices - both the European and the American - the basis of comparison is therefore 20 previous quarters, but for the Stoxx 600 it is the last half-year that is "in the numerator", so to speak, and for the S&P 500 sectors it is the last quarter.
Among the S&P 500 industries, seven of the nine most recently achieved higher Ebitda margins than in the previous 20 quarters. Only consumer staples and utilities performed worse, by 2.9 and 3.1 percentage points respectively (chart 2).
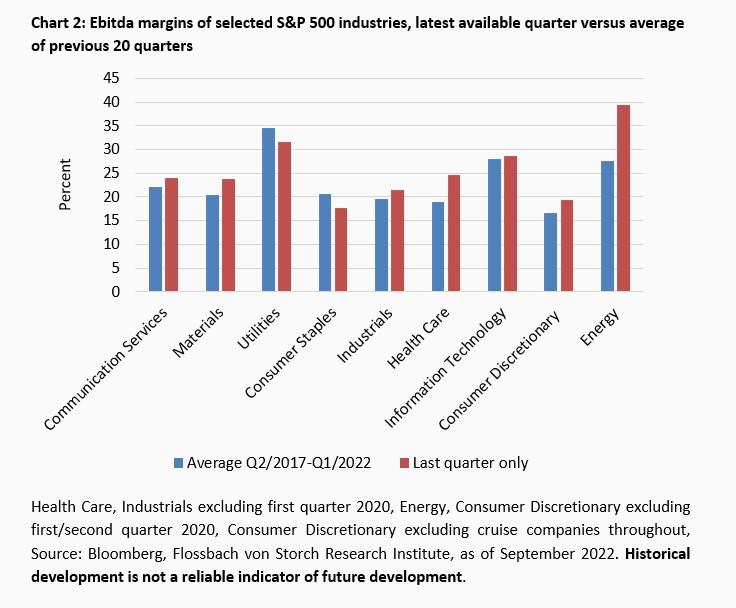
On average, the margin of all companies was 25.6 percent, 2.5 percentage points higher than in the same period last year. However, the relative increase of 10.7 percent is largely due to the energy sector. Without this currently very profitable sector, margins would still have widened on average by 1.3 percentage points.
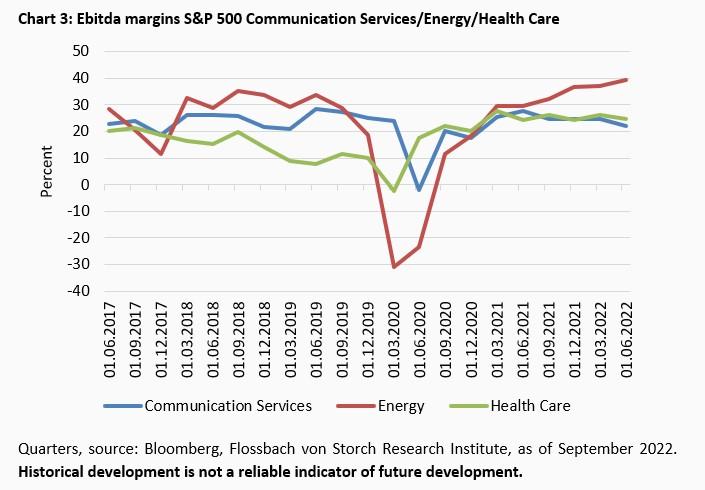
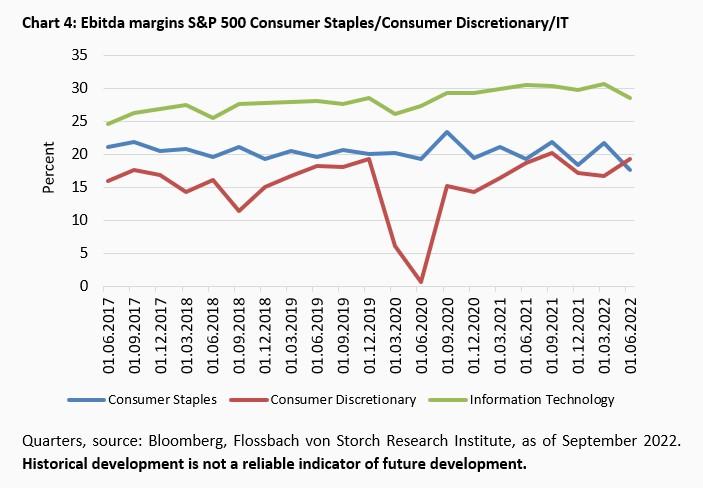
While the energy sector in the S&P 500 is currently generating record high margins over the comparison period, the margins in the health care sector and in communication services are also at a high level and slightly sloping downwards (chart 3).
The IT sector of the S&P 500 is stable, with a slight downward trend at a very high level. While consumer staples companies are currently having to cut back on margins, companies that provide consumers with non-essential consumer goods ( "Consumer Discretionary ") are seeing rising margins (chart 4).
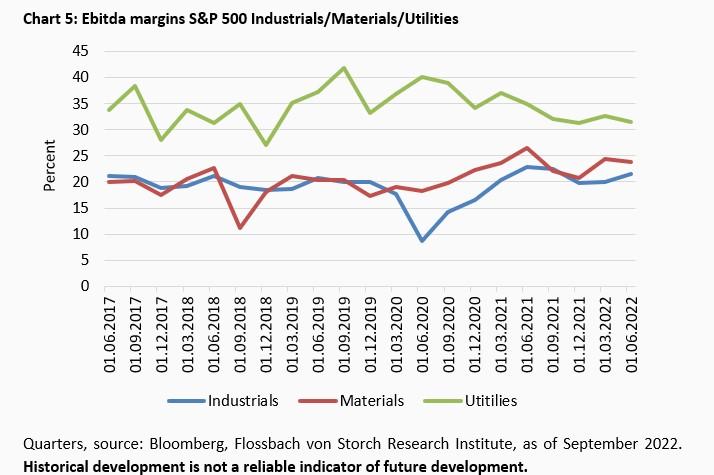
The industrial sector (e.g. mechanical engineering, metal processing or cement) shows rising margins this year, as does the materials sector, which includes the US chemical companies, for example. In utilities, on the other hand, margins are crumbling and are well below the level of previous records set in mid-2019 (chart 5).
In Europe, the overall picture is similar to that in the USA. In 12 out of 14 sectors of the Stoxx 600, Ebitda margins in the first half of 2022 were above those of the previous five calendar years (chart 6).
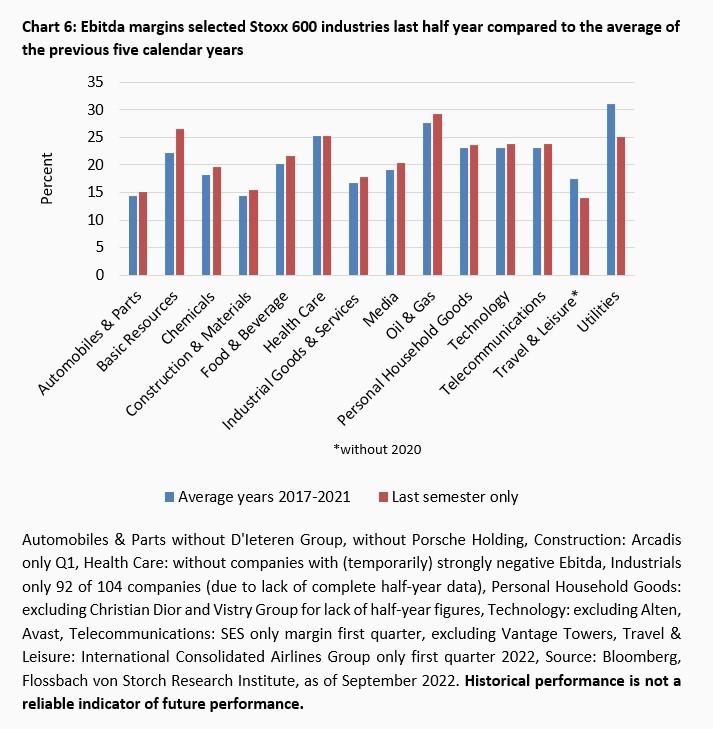
Only travel companies and utilities underperform - the latter is a parallel to their US counterparts. However, the margin of all companies in the first half of the year is only 0.4 percentage points higher than the average of the previous five calendar years. The increase is thus significantly lower than the average for US companies.
If you leave out the weak utilities and travel companies, you get an increase of 1.2 percentage points. The highest margins in the Stoxx 600 this year were also achieved by the oil and gas sector.
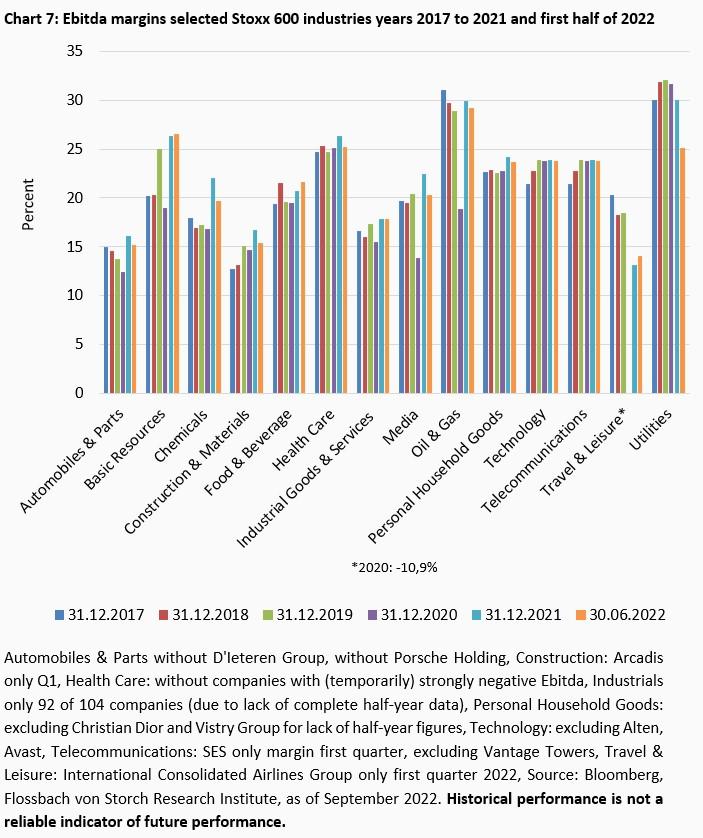
However, most sectors can only maintain their margin level from 2021 or are slightly below it. Groups from the beverage and food industry as well as raw material/steel companies (basic resources) can slightly increase their margins, while technology and telecom companies, among others, are stable in the race (Chart 7).
It can be assumed that weak currencies such as the euro or the pound sterling are cost-driving on the purchasing side and therefore larger jumps in Ebitda margins cannot be observed on average. US companies are likely to have an advantage here due to the relative strength of the dollar.
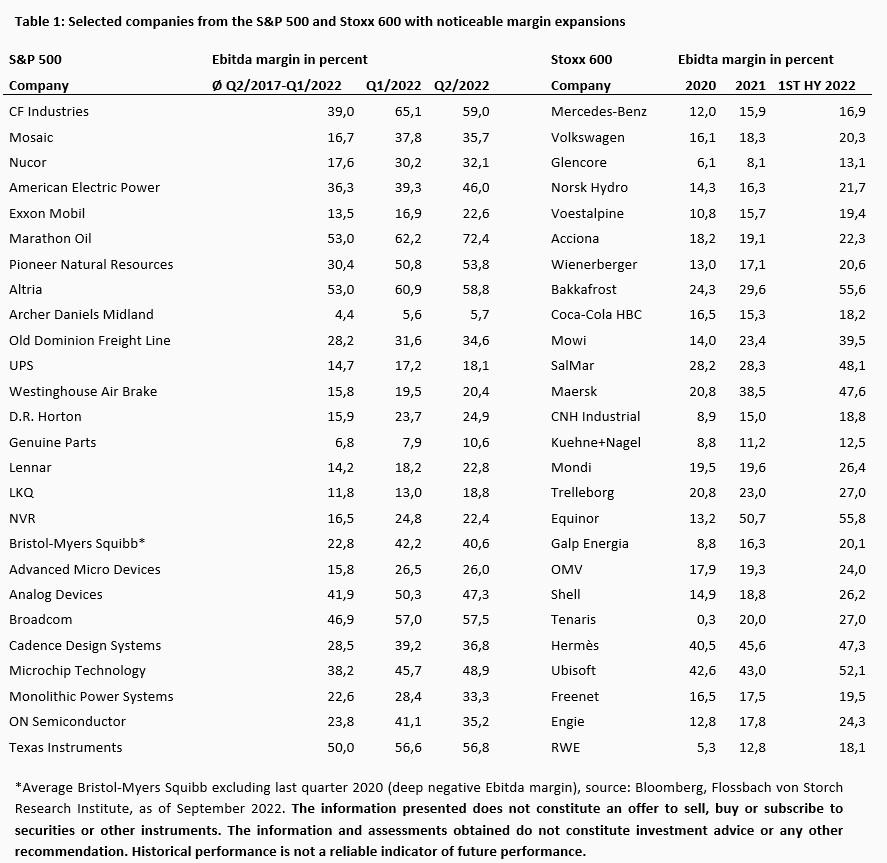
The average is one thing, the individual case is another. Thus, in every industry and on every continent, there are companies that expand their margins with the trend or even manage to do so disproportionately. Others lag behind the general trend. In any case, companies that have expanded their Ebitda margin this year are not rare (Table 1).
For investors, however, it is not only the pure margin development that is interesting, but also the extent to which companies are able to possibly achieve higher profits in absolute terms. Logically, this is where the revenue side comes into play. After all, higher revenues with already stable margins promise more profit at the bottom line. And here, on the revenue side, companies are chasing records - thanks to inflation, or so it would appear.
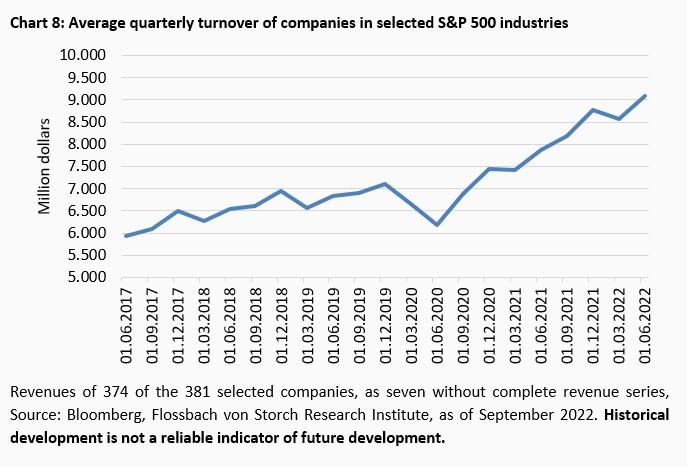
For the selected S&P companies, sales in the last available quarter are on average 29.5 percent above the level of the 20 preceding quarters. If you exclude the weak second quarter in the Corona year 2020, you still get a plus of 28.7 percent. Compared to the same period of the previous year, the current quarterly revenue increase is 15.6 percent (chart 8).
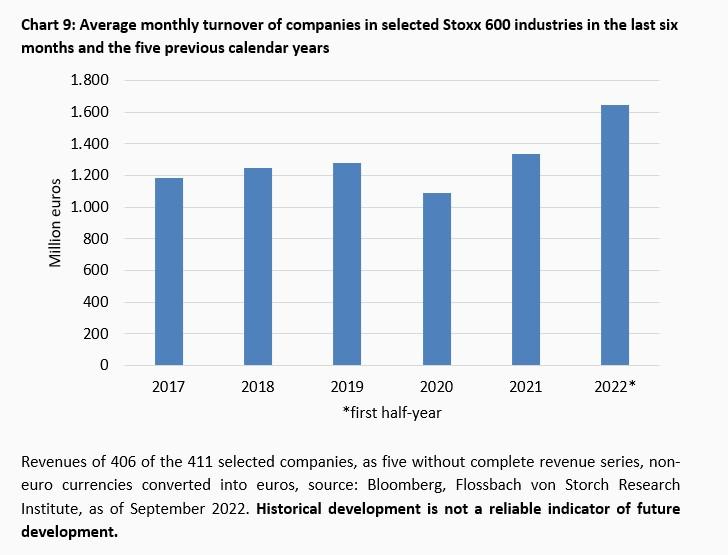
For the selected Stoxx 600 companies, sales this year are on average 33.9 per cent higher on a monthly basis than in the previous five years. If you exclude the weak Corona year 2020, you still get a plus of 30.2 percent. Compared to the previous year's average, this results in a revenue increase of 23.3 percent (Chart 9). The significantly stronger growth compared to US companies is likely to reflect the weakness of European currencies, which has a positive effect in this case.
Listed companies are coping well with the significant general price increases so far. Ebitda margins are regularly close to stable, stable or even higher than recently and are mostly above the averages of the past five years.
At the same time, there is a clear increase in turnover. Should both continue, then in 2022 the average of the companies considered should show noticeably higher profits on the basis of Ebitda in a year-on-year comparison and in comparison with the past years. This is especially true for US companies.
In Germany, the widening of margins by the large car manufacturers is unlikely to go unnoticed by IG Metall as the wage round in the metal industry gets underway.
The extent to which higher margins can be maintained in an environment with possibly permanently higher inflation requires regular analysis. The tendency is right from the point of view of the stock market. But whether a trend will emerge from it remains to be seen.


Legal notice
The information contained and opinions expressed in this document reflect the views of the author at the time of publication and are subject to change without prior notice. Forward-looking statements reflect the judgement and future expectations of the author. The opinions and expectations found in this document may differ from estimations found in other documents of Flossbach von Storch AG. The above information is provided for informational purposes only and without any obligation, whether contractual or otherwise. This document does not constitute an offer to sell, purchase or subscribe to securities or other assets. The information and estimates contained herein do not constitute investment advice or any other form of recommendation. All information has been compiled with care. However, no guarantee is given as to the accuracy and completeness of information and no liability is accepted. Past performance is not a reliable indicator of future performance. All authorial rights and other rights, titles and claims (including copyrights, brands, patents, intellectual property rights and other rights) to, for and from all the information in this publication are subject, without restriction, to the applicable provisions and property rights of the registered owners. You do not acquire any rights to the contents. Copyright for contents created and published by Flossbach von Storch AG remains solely with Flossbach von Storch AG. Such content may not be reproduced or used in full or in part without the written approval of Flossbach von Storch AG.
Reprinting or making the content publicly available – in particular by including it in third-party websites – together with reproduction on data storage devices of any kind requires the prior written consent of Flossbach von Storch AG.
© 2024 Flossbach von Storch. All rights reserved.

Christof Schürmann
Senior Research Analyst
At the Institute since 2022. The graduate in business administration (FH), previously worked as a journalist and deputy head of "Money" at WirtschaftsWoche. The trained banker and book author ("Die Bilanztrickser") taught balance sheet research part-time at the private university BiTS in Iserlohn.
All articles by Christof Schürmann