Asset price inflation in Italy: The young and poor suffer
25.03.2025 - Philipp Immenkötter
In Italy, asset prices have risen rapidly for four years in a row. High government spending has pushed up asset prices. Retirement planning and real estate investments are becoming more expensive. This raises the potential for social conflict, as young and poor households can be left behind.
Periodic investments in real and financial assets play a crucial role in shaping a household’s future wealth. The ability to make such investments depends on the prices of real and financial assets, which are subject to fluctuations and driven by inflation.
In the following, we introduce the new Flossbach von Storch asset price index for Italy to trace the development of asset prices in Italy and hence the cost of wealth accumulation for private Italian households. The price index is calculated as the weighted average of the price development of real assets (real estate, business wealth, durable consumer goods, and collectors’ items) and financial assets (stocks, bonds, cash equivalents and other financial assets) owned by private households. Real estate is the largest asset held by Italian households, accounting for 63 percent of total household wealth. A detailed description of the methodology can be found in the appendix.
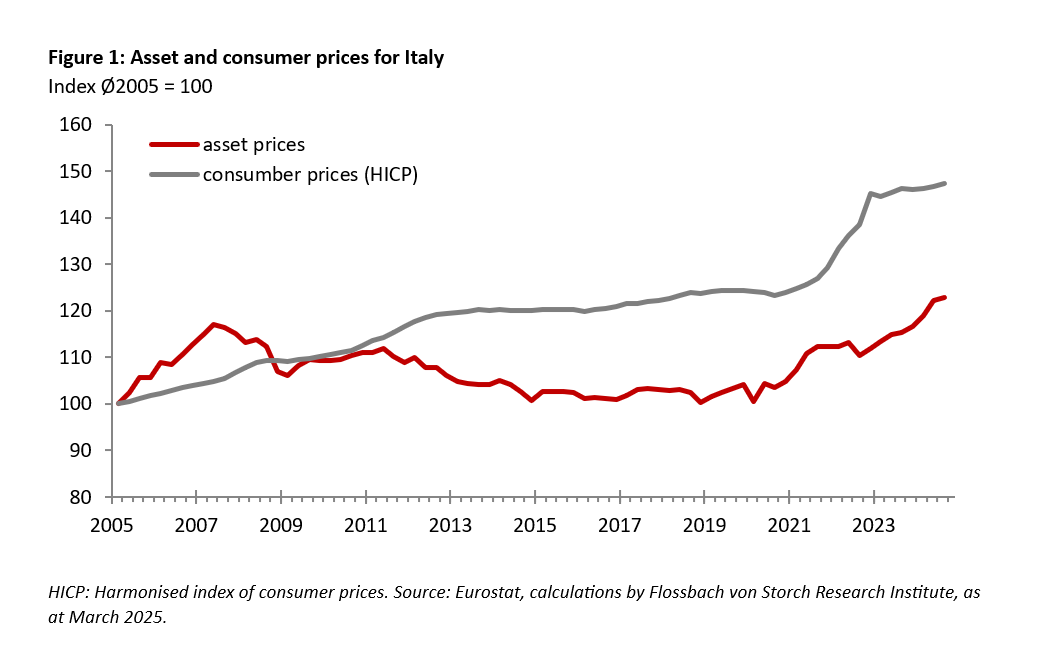
The asset price index highlights the declining purchasing power of private Italian households in wealth accumulation and retirement planning. Over the past four years, asset prices have risen by 20%, meaning households now must spend 20% more on the same investments as before. In comparison to other countries of the eurozone, such as Germany and Spain, the long-term increase is rather small but most of the price increase occurred within the last four years, suggesting a structural change in the development of asset prices.
Asset price inflation is driven by factors such as economic growth, government spending, and monetary policy. While the stagnation of the Italian economy kept asset price inflation low for more than a decade, the Italian fiscal policy after the Corona crisis caused a structural change and fueled asset price inflation. Substantial government spending supported by the NextGenerationEU fund such as the Superbonus boosted prices for real estate and business wealth. As growth has not kept pace with this increase, the ability of Italian households to build wealth has been significantly reduced. Therefore, fiscal policy has further exacerbated wealth inequality.
The past decade of high asset price inflation in Germany and Spain, has demonstrated how wealth accumulation can lead to shifts in wealth inequality among private households. A growing share of the population can no longer afford real estate or invest adequately in retirement planning, with young and low-income households being particularly affected. Germany and Spain offer a glimpse of what may lie ahead for Italy if the impact of fiscal spending on prices of real and financial assets continues without growth.
Development of asset prices in Italy
Asset price inflation is now in full swing in Italy. Prices for the assets of private households rose by 6.4 percent year-on-year at the end of the third quarter of 2024 as seen in figure 1. In contrast, consumer prices as measured by the Harmonised Index of Consumer Prices for Italy (HICP) rose by only 0.8 during the same period. Although asset price inflation is currently high, there have been different phases over the past 20 years. Asset prices surged before the European financial and debt crisis but then declined for 12 years. In 2019 asset prices started to rise again and remained on this upward trajectory ever since.
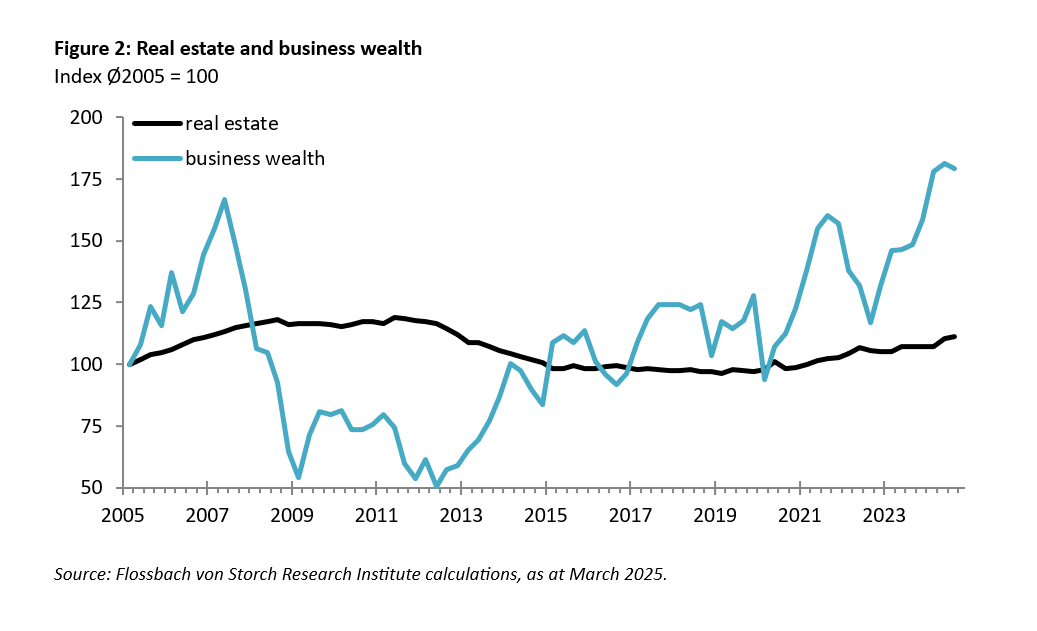
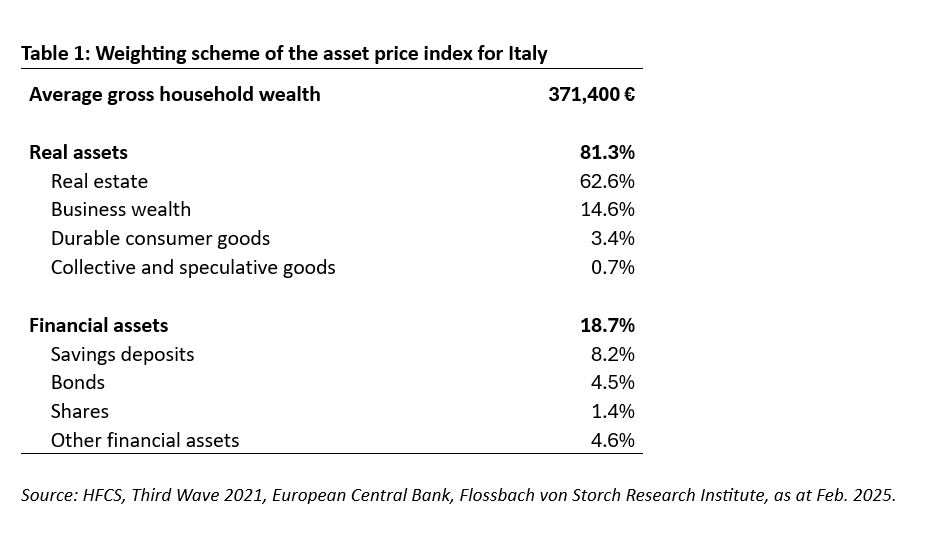
The asset price index is mainly driven by the two asset categories real estate and business wealth, which together account for three quarters of Italian private household wealth. Real estate accounts for 62.6 percent of household wealth, while business wealth makes up 14.2 percent. The third largest asset is savings deposits (8.2 percent) which is not subject to price changes. The other five asset categories each account for less than five percent of the total index each. Figure 2 shows the price development of real estate and business wealth, which together amount to three quarters of the index. The price development of the remaining asset categories is shown in the appendix.
The Italian real estate market last peaked in 2011. In the wake of the European financial and debt crisis, real estate prices fell by almost 20 percent until 2015 and then stagnated for five years. With the Corona pandemic real estate prices started to increase again but have not yet surpassed the 2011 peak and are ranging still almost eight percent below the peak.
Prices for business wealth are more volatile than real estate prices as they reflect a stream of future income subject to frequently changing expectations. During the financial crisis, prices for business wealth fell sharply and recovered only gradually. Since 2012, prices for business wealth followed an upward trend with high volatility. Most recently prices for business wealth surpassed their all-time high of 2007.
What drives the development of asset prices in Italy?
There are three factors that determine asset price movements: growth, government expenditures and monetary policy. These factors are not independent of each other.
1. Economic growth
The first factor that drives asset prices is growth. A growing economy allows private households to increase their demand for real and financial assets due to their growing stream of income. The level of the income determines a household’s savings, which provides the basis for investment in real and financial assets. Recessions and shrinking incomes, in contrast, limit the ability to invest in assets or even forces households to liquidate their assets (Keynes 1936, Lucas 1978, and others).
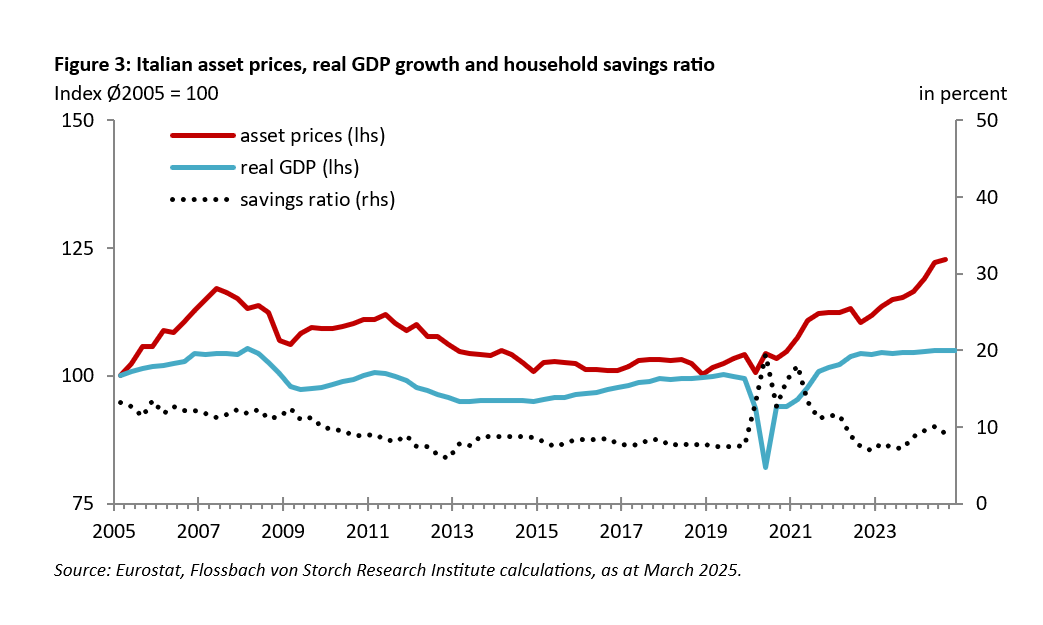
Figure 3 shows that the rise in asset prices before the European financial and debt crisis coincided with real GDP growth. The prices of real estate and business wealth benefited from the expanding economy. As the Italian economy stagnated and eventually contracted during the crisis, asset prices started to fall. Declining and volatile household income led to declining savings ratios and weak demand for real and financial assets. Particularly, real estate prices suffer during periods of low economic growth due to a low demand for housing (Leamer 2007). In addition, banks employed stricter lending policies, thereby further dampening the demand for real estate.
Business wealth and equities reflect forward-looking asset prices (Stock & Watson 2003) and therefore react faster and earlier to changing economic conditions than real estate prices. In particular, the onset of a crisis lead to a sudden fall in the prices of business wealth and equities. When economic growth began to recover gradually in 2014, it helped stabilize asset prices.
After a swift recovery following the Corona crisis, Italy's economy grew steadily until 2022 but has stagnated since 2023. However, asset prices have been rising since 2019 and have continued to increase even as growth and the savings ratios have stalled. This suggests that growth is unlikely to be the main driver of the current asset price inflation.
2. Government expenditures
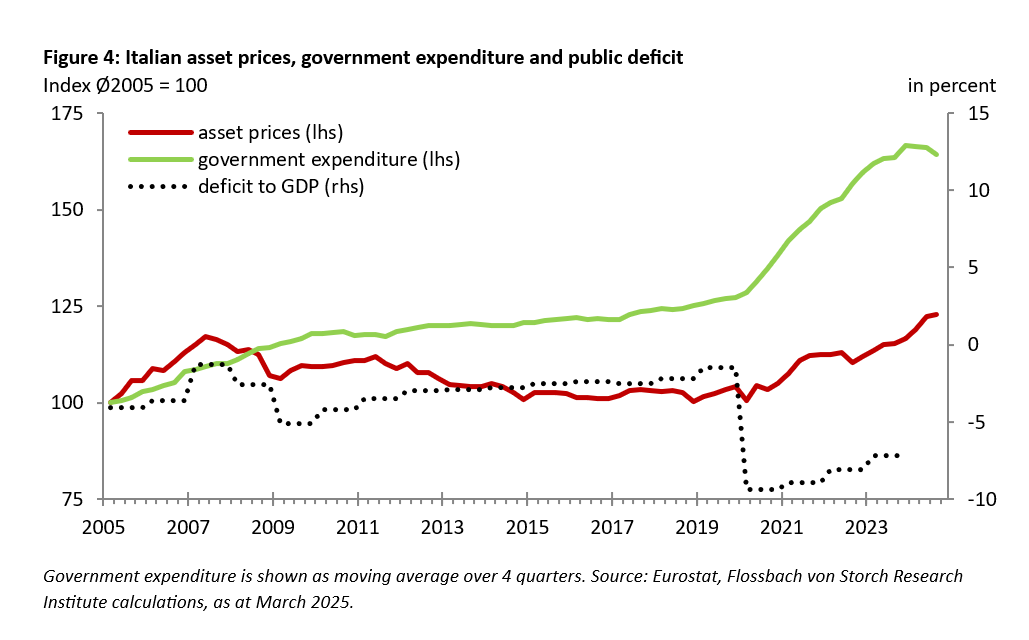
Government expenditures affect prices in an economy (Keynesian business cycle theory, Cochrane 2023,). As shown in figure 4, government expenditures grew until 2010, but then expenditure growth slowed down. A high fiscal deficit of the Italian government limited the government’s ability to increase public spendings. With the Corona crisis, government expenditure surged as the government tried to stabilise the economy in hope for a quick recovery. The NextGenerationEU (NGEU) fund1by the EU, and the Recovery and Resilience Facility (RFF)2 with it, allowed Italy to expand its government expenditure quickly and substantially. By November 2024 Italy had received about 114 billon Euro through the NGEU fund, representing about 5 percent of its GDP. About half of the funds represent capital flows to Italy because Italy is expected to receive a quarter of the NGEU fund but contributes only with 12 to 13 percent to the EU budget.
Over the past four years, the Italian government expenditures have grown by nearly 30 percent. In particular, the Italian government supported investments in real estate with help of the so called “Superbonus 110%” program3 of 2020, that provides tax credits for investments in real estate. The tax credits are recorded by the government as an expenditure and are reflected in the public deficit.4 By 2024, the tax credits provided by the Superbonus and other existing support schemes amounted to 10 percent of Italy’s GDP. Since its introduction, the Superbonus drove up construction costs and caused real estate prices to rise substantially for the first time since 2007 (Corsello and Ercolani 2024). Prices for business wealth benefited from the Superbonus as well, through high profit expectations in the construction industry and related businesses.
The resulting economic impact of the Superbonus and related programmes on Italy’s GDP is significant, but small compared to the volume of the programmes. Accetturo et al (2024) argue that the costs exceed the economic benefit. The Superbonus encouraged fraud5 and shortage in labour, raw materials and prioritising of subsidized work drove up real estate prices (Codogne 2024). For the years 2021 to 2024 the Superbonus and related schemes caused additional government deficits between 2.3 and 3.9 percent of GDP annually (FitchRatings 2024). Most likely, there is no positive impact of the government spending on growth. Asset price inflation due to government spending is an unwanted side-effect rather than the original objective.
3. Monetary Policy
The third possible explanation for the development of asset prices in Italy is the European Central Bank’s (ECB) monetary policy. Higher money supply serves as necessary condition for inflation and can drive up asset prices (Economic theory of monetarism, Friedman and Schwartz 1963, Campbell 2008). Falling interest rates increase asset values by raising the present value of future income streams (Gordon 1959).
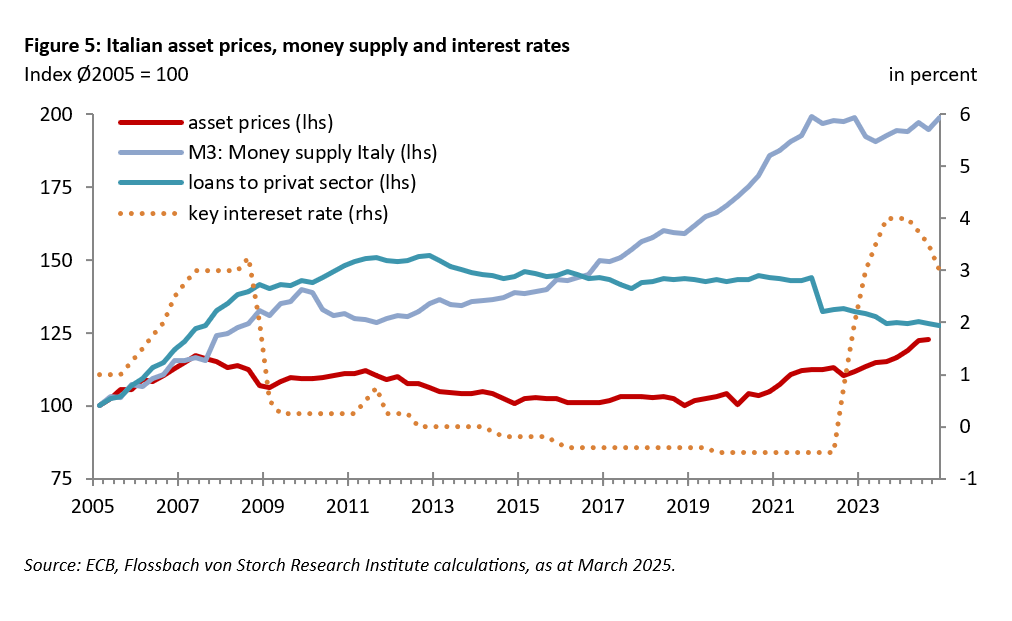
Figure 5 shows the expansion of the money supply in Italy in the wake of the ECB’s expansionary monetary policy that serves as necessary condition for inflation in the eurozone. However, it did for a long time not lead to an increase in asset prices to rise in Italy. Low growth and uncertainty about future earnings may have outweighed the effects of falling interest rates. Loans to the private sector, that represent newly created money, did not increase over time.
Nevertheless, the lowering of interest rates by the ECB since 2014 and the extensive government bond purchases allowed the Italian government to expand the government expenditures. Through asset purchase programs such as PSPP and PEPP, the ECB kept the demand for Italian government bonds high and hence long-term interest rates low. By maintaining a steady demand for Italian government bonds and suppressing yields, the ECB's asset purchase programs supported Italy's fiscal expenditures. This mechanism allowed Italy to pursue an expansionary fiscal policy without facing substantial interest rate constraints.
Since 2022, the ECB has raised key interest rates but began cutting them again in 2024. The rise in the interest rates due to rising consumer price inflation caused the value of equities and business wealth to drop in 2022. Market expectations indicate further rate cuts ahead (FT 2025). Possibly, the expectation of falling interest is currently driving up the prices for financial assets of private Italian households.
Asset prices in other European countries
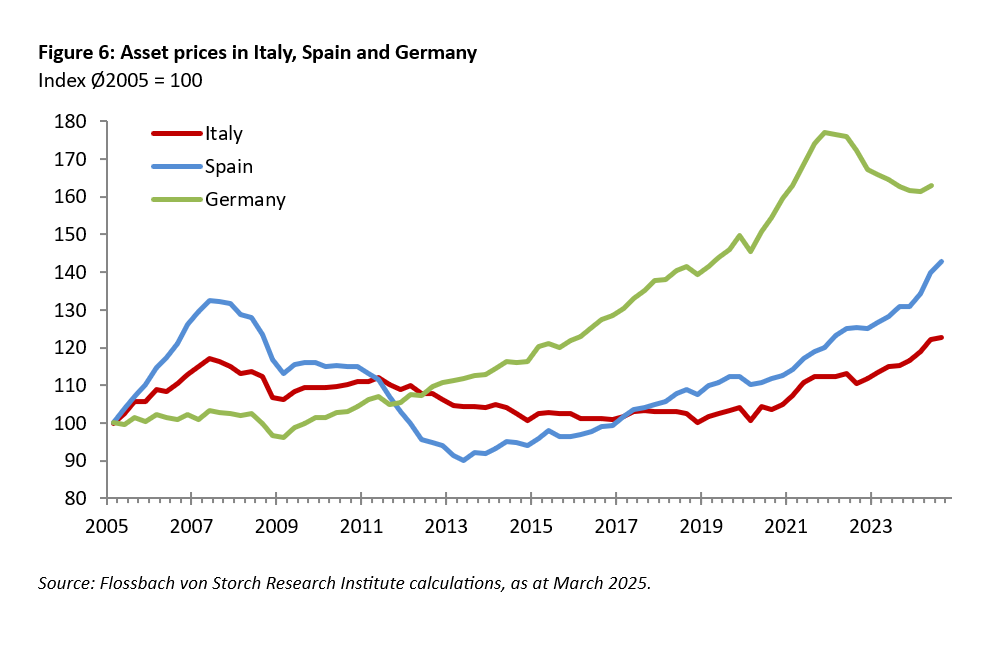
Compared to other Eurozone countries like Spain and Germany, asset price inflation in Italy has remained relatively low as shown in figure 6. In the long run, asset price inflation in Spain is almost twice as high as in Italy.
Before the European financial and debt crisis, Spain experienced an asset price bubble that eventually burst, followed by recession. As the Spanish economy began recovering in 2013, asset prices started to recover. As the recovery took up speed after the corona crisis, Spanish asset prices soared. In 2024, inflation surged past 9 percent per year, driven by a combination of growth, increased government spending, and falling interest rates.
In Germany, where asset prices grew slowly before 2007 and economic recovery set in already in 2009, a sustained trend of asset price inflation emerged. While growth contributed to rising asset prices, they were largely driven by the ECB's expansionary monetary policy. Low interest rates, combined with stable expected earnings, fueled a surge in real estate prices, pushing asset price inflation above 10 percent in 2021. The low interest rates also led to high valuations of other real and financial assets. However, as interest rates rose in 2021 and growth weakened, asset prices declined. By 2024, with expectations of falling interest rates, asset prices in Germany began to recover.
Social consequences of asset price inflation
High asset price inflation, as currently in Italy, carries the potential for social conflict. Rising asset prices primarily benefit households that already own assets such as real estate, business wealth and financial assets. Households owning these assets can increase consumption by spending their gains or use their increased wealth as collateral for further credit-financed investments or consumption (Ludvigson 2013). However, assets are not evenly distributed among the population. The wealth of the ten percent richest households in Italy is twelve times higher than that of the Italian middle class (ECB 2023a). In addition, wealthy households are more likely to own shares and real estate in populated urban locations, which are currently rising significantly in price. For example, only four to five percent of buildings benefited from the Superbonus which are more likely to be in the possession of wealthier households (Codogno 2024).
Young households and households with few assets or low income do less benefit from the wealth effect. Instead, high asset price inflation is making it more difficult for them to build up wealth and to save for retirement. Homeownership and investment in financial assets for retirement is becoming more costly or even impossible.
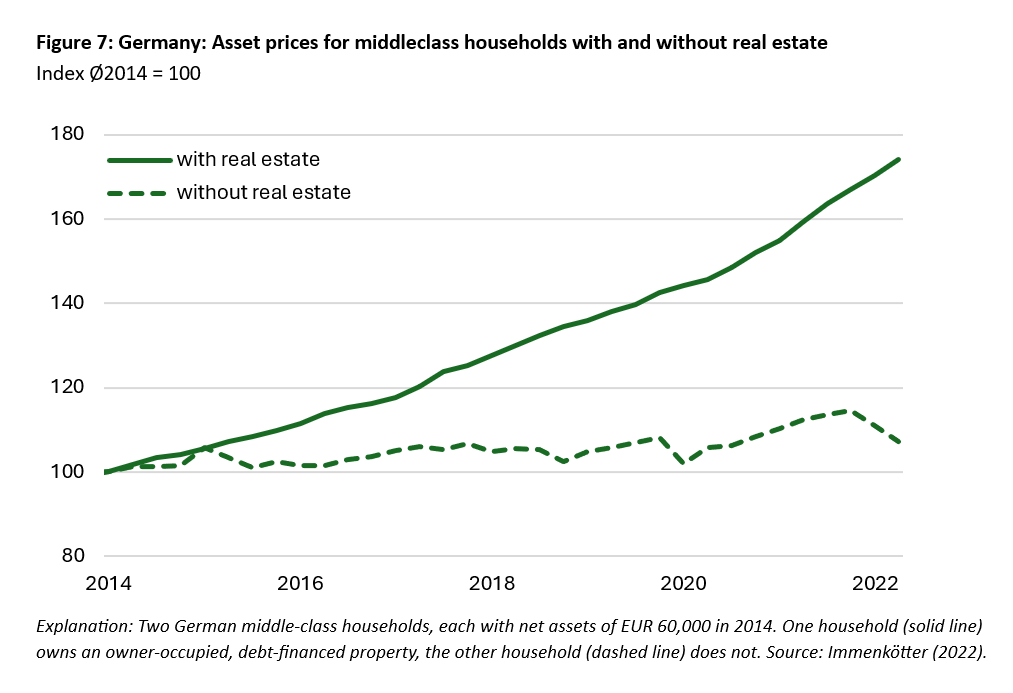
Evidence from Germany illustrates how asset accumulation and retirement planning have become increasingly expensive during the period of high asset price inflation (Immenkötter 2022). Figure 7 shows the price development of the assets of two middleclass German households with the same net wealth from 2014 to 2022, but with different investment patterns. The first household owns debt financed real estate (solid line), while the second does not (dashed line). Instead, the second household owns financial assets that match the statistical asset allocation of financial assets for non-real estate owners in Germany. During the eight years of high asset price inflation in Germany (2014 to 2022) the price of the first household’s assets increased by 75 percent, while the price of the other household assets rose by just five percent. The distance between the lines reflects the increasing cost of asset accumulation due to asset price inflation. An investment by the second household in the assets of the first household has become 70 percentage points more expensive. Asset price inflation, primarily mainly driven by real estate and financial assets, has widened the wealth gap between less wealthy and wealthy households in Germany.
If asset price inflation is constantly fuelled by government expenditures and monetary policy and thus remains high in the long run, the financial and economic situation of young households, which are also affected by high unemployment and consumer price inflation, may deteriorate further. The already existing wealth gap may widen, leading to social conflict.
Outlook
The most recent asset price inflation in Italy is due to the combination of an expanding government expenditures and a subsidized demand for real assets enabled by the monetary policy of the ECB and supported by EU policies. However, the most recent demand for assets seems not to originate in growth, but rather in the demand of few households that benefited from public spendings. If the government support for the demand for assets in Italy diminishes, asset prices, especially for real estate and business wealth could collapse.
The asset price inflation caused by government actions had already significant implications for wealth accumulation and financial security, particularly for young and lower-income households. While rising asset prices benefit those who already own assets, they create barriers for those trying to build wealth, deepening economic and social disparities. If this trend persists, Italy may follow the path of Germany and Spain, where high asset price inflation has exacerbated wealth inequality.
If asset prices possibly collapse it will coincide with recession and stagnation that hits young and poor households harder than wealthier households, so that they possibly do not benefit from falling asset prices.
Understanding these dynamics through the Flossbach von Storch asset price index provides valuable insights for policymakers, households and financial advisors alike, emphasizing the need for strategies that ensure equitable financial opportunities for all.
Appendix
A. Methodology of the Flossbach von Storch Asset Price Index for Italy
The asset price index measures the price development of assets owned by private Italian households. The asset composition of the average Italian household is calculated based on “The Household Finance and Consumption Survey: Results from the Wave 3” (ECB 2023b).
The assets of a private household are split up into real assets and financial assets. Real assets consist of real estate, business wealth, durable goods, and collectors’ items. Financial assets are broken down into cash equivalents, bonds, stocks and other types of financial assets. Table 1 reports the asset break down of the average private Italian household. The reported values serve as weights for the asset price index. The index is calculated as a Laspeyres price index. Each time series is indexed in 2021 which is the year that the results of the HFCS refer to. For charting all resulting time series are indexed to 100 at the beginning of the year 2005.
For each asset class, we calculate the country-specific quarterly price change. We use asset prices and not asset valuation indicators and we exclude cash flows from assets, such as interest, dividends or rental yields. Real estate prices are provided by Eurostat, business wealth is measured using the MSCI Italy Small Cap price index. The price development of durable consumer goods is captured through the HICP time series provided by Eurostat. Collectibles and speculative items are represented through four subcategories: jewellery (Eurostat), art (Art Market Research), fine wines (Liv-ex Ltd.) and historic automobiles (Historic Automobile Group International).
The geographical distribution of stock and bond investments by Italian households is captured using the International Monetary Fund’s (IMF) Coordinated Portfolio Investment Survey (CPIS). The price development of the resulting investments is measured with help of MSCI country and regional stock price indices and Bloomberg bond indices. The price of other financial instruments is measured with help of the London Bullion gold price and ThomsonReuters Continuous Commodity Index, both provided by Refinitiv.
B. Price development of real and financial assets
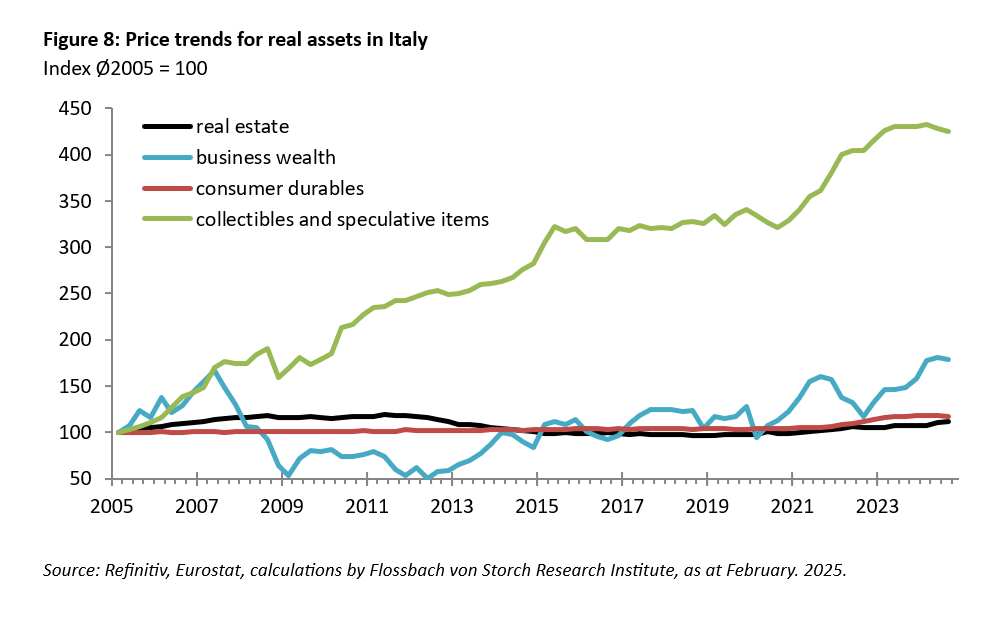
Figure 8 shows the price development of all four categories for real assets. The price for collectibles and speculative items rose 8 percent year on year, its impact on asset price inflation is low as collectibles and speculative items account only for 0.7 percent of private household wealth.
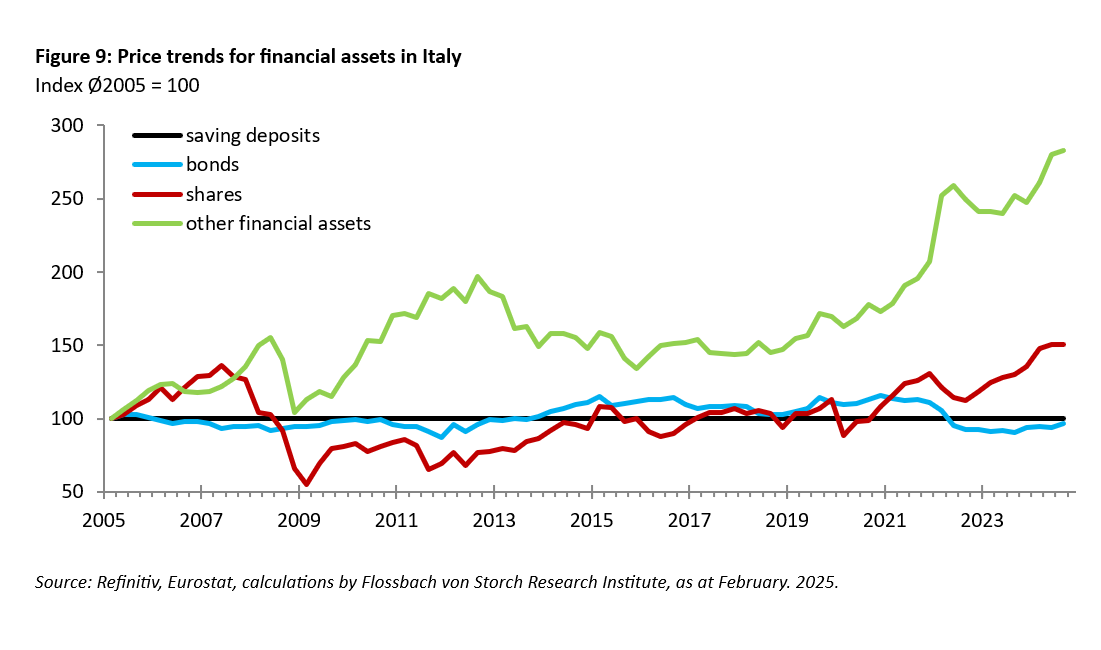
The price development of all four categories of financial assets is shown in figure 9. In the long run the strongest price increase is recorded for other financial assets (5.4 percent p.a.) that is driven by the price for gold that benefited from low interest rates, economic uncertainties and geopolitical conflicts.
References
Accetturo, A., Olivieri, E. and Renzi, F. (2024): “Incentives for dwelling renovations: evidence from a large fiscal programme”, Questioni di Economia e Finanza, Banca d’Italia, Number 860, June 2024.
Codogne, F. (2024): “Italy’s Superbonus 110%: Messing up with demand stimulus and the need to reinvent fiscal policy”, LUISS Institute for European Analysis and Policy, Working Paper 12/2024.
Corsello, F. and Ercolani, V. (2024): „The role of the Superbonus in the growth of Italian construction costs”, Questioni di Economia e Finanza, Banca d’Italia, Number 903, Dezember 2024.
Cochrane, J. H. (2023). The fiscal theory of the price level. Princeton University Press.
ECB (2023a): “The Household Finance and Consumption Survey, Wave 2021, Statistical tables”, p.6, July 2023.
ECB (2023b): “The Household Finance and Consumption Survey: Results from the 2021 Wave” (HFCS), European Central Bank, Statistics Paper Series, July 2023.
Eurostat (2022): “Manual on Government Deficit and Debt – Implementation of ESA 2010”, 2022 edition.
Eurostat (2024): Households - statistics on income, saving and investment, November 2024.
Financial Times (2025): Euro falls to 2-month low as investors price in interest rate cuts”, Monetary Policy Radar, 30.01.2025.
FitchRatings (2024): Italy’s ‘Superbonus’ Spending Puts Its Debt Ratio on an Upward Trajectory, 23.04.2024
Friedman, M. and Schwartz, A. J. (1963): “A Monetary History of the United States, 1867–1960", Princeton University Press.
Gordon, M. J. (1959): “Dividends, Earnings, and Stock Prices,” Review of Economics and Statistics, Vol. 41, No. 2, pp. 99–105.
ItalyNextGeneration.eu: www.italynextgeneration.eu/recoveryfund-en/, retrieved Feb. 2025.
Immenkötter (2022): “Inflation’s footprint on our society”, Flossbach von Storch Research Institute, Commentary.
Keynes, J. M. (1936). The general theory of employment, interest, and money. Macmillan.
Leamer, E. (2007): “Housing is the Business Cycle,” Proceedings of Economic Policy Symposium, Housing, Housing Finance, and Monetary Policy, Federal Reserve Bank of Kansas City, August 30–September 1, Jackson Hole, pp. 149–233.
Lucas, R. E. (1978): “Asset prices in an exchange economy”. Econometrica, Vol. 46. No. 6, 1429–1445.
Ludvigson, S. C. (2013): “Chapter 12 - Advances in Consumption-Based Asset Pricing: Empirical Tests” in Handbook of the Economics of Finance, Vol. 2, Part B, 2013, p. 799-906.
Stock, J. H., and M. W. Watson, 2003, “Forecasting Output and Inflation: The Role of Asset Prices,” Journal of Economic Literature, Vol. 41, No. 3, pp. 788–829.
Data sources
Art Market Research Developments Ltd.
Bloomberg L.P.
Eurostat
European Central Bank (ECB)
Oxford Economics
HAGI (Historic Automobile Group)
International Monetary Fund (IMF)
Liv-ex Ltd.
Macrobond Financial
MSCI Inc.
Refinitiv
_________________________________________________________________________
1 The NextGenerationEU fund is an EU economic stimulus package to contain and mitigate the economic and social impact of the COVID-19 pandemic in the member states. Over €208 billion is to be invested in Italy through the fund. One branch of the fund is the National Recovery and Resilience Plan (PNRR) that amongst others targets investment in real estate and Italian businesses.
2 Italy’s recovery and resilience plan - European Commission
3 The “Superbonus” provides tax deductions for expenses related to energy and seismic renovation of residential buildings in Italy (Link).
4 The Superbonus qualifies as a “payable tax credit” which is recognized by the government as expenditure and thus reflected in the deficit to GDP ratio even though it is a reduction in cash revenues for the government (See Codogne 2024 and Eurostat 2022).
5 Around 11,000 construction companies were set up ad hoc by the end of 2013 to take advantage of the tax benefits of the Superbonus and closed immediately afterwards, raising strong suspicions of fraud and triggering investigations by the Italian tax police. See Codogne (2024).
