Companies
A schematic analysis of S&P 500 companies based on current and near-future valuation metrics shows that sectors outside the mainstream sometimes exhibit moderate valuations. Within each sector, there are companies that might be worth a second look.
Experience shows that a boom in a limited number of shares tends to overshadow positive business developments at other companies and in other sectors (Pástor, Veronesi 2009). However, neglected shares may have positive future return effects on a portfolio (Arbel, Carvell, Strebel 1983). Whether this might also be the case at present will be examined below.
The analysis covers the eleven sectors into which the S&P 500 is divided.1 How have profits and cash inflows developed here over the past ten years, and what is the current and future valuation in light of the earnings analysts expect for the next four quarters? The aim is to provide an overview of the sectors’ attractiveness, as well as a breakdown of individual shares that, on closer inspection, might warrant more in-depth analysis. Should the semiconductor boom come to an end, there could be rotation into other sectors less dependent on it. Positioning oneself early on can do no harm.
High concentration in the S&P 500
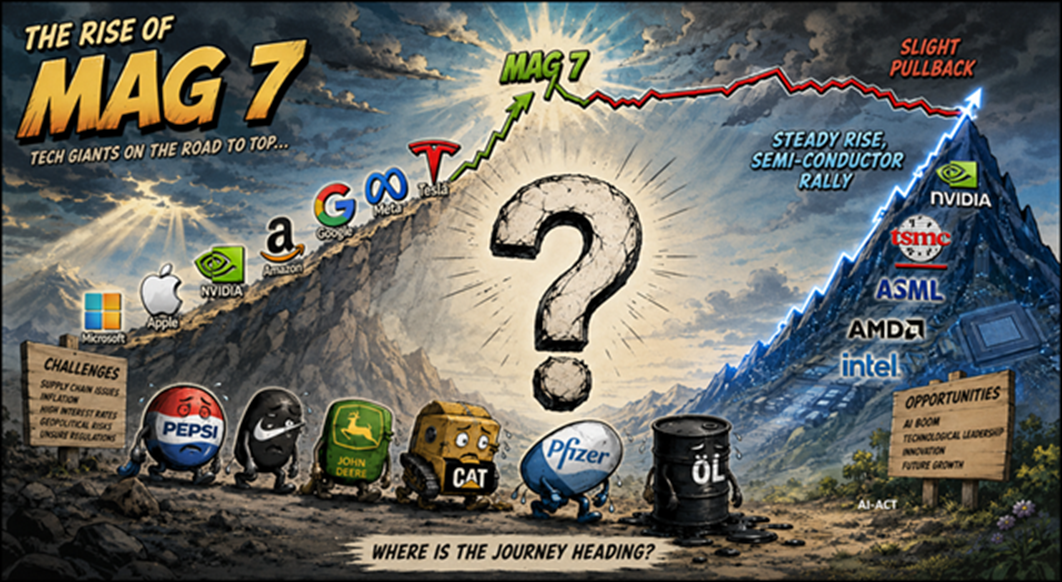
The analysis yields a clear result: 45 per cent of the market capitalization in the S&P 500 is directly linked to the artificial intelligence boom. Semiconductor shares account for a record 18 per cent of the S&P 500, the world’s most important share index. In terms of value growth, they have recently overtaken the previous boom of the ‘Magnificent Seven’ (‘Mag7’: Apple, Nvidia, Alphabet, Meta, Amazon, Tesla and Microsoft). By the final week of June 2026, semiconductor shares had roughly doubled in value compared with the start of the year, whilst the Magnificent 7 were down slightly – even though Nvidia, the original leader of the chip rally, is one of them. Nevertheless, the Mag7 currently account for just under a third of the total weight of the S&P 500.
Such a high concentration – where a few shares from a limited universe account for the bulk of a broad index – is not unusual. In March 2000, no fewer than five telecoms’ stocks featured among the top ten global shares. This is not a problem for an index as long as this dominance does not lead to valuations rising far beyond the usual level. However, this could currently be the case. According to calculations by Landesbank Baden-Württemberg, corporate profits in the S&P 500 have risen only half as much as the index since the start of the current bull market.
The rush for semiconductor stocks is not limited to the US stock market. In June 2026, SK Hynix overtook Samsung Electronics as the most valuable listed South Korean company. At the end of June, the two companies dominated the Seoul Stock Exchange’s benchmark KOSPI index, accounting for more than half of its total value.
Historically high valuations
The prolonged rise of the Mag7 and the boom in chip shares – which, as measured by the US semiconductor index SOX, have more than quadrupled in price since a temporary low in spring 2025 – are having an impact on the overall market valuation. The so-called Buffett indicator, which shows the market capitalization of the US stock market relative to US gross domestic product, is signaling a record high (Figure 1).

However, this record level does not in itself carry any particular significance. What matters are valuation metrics such as the price-to-earnings ratio (P/E ratio). Measured against long-term, price-adjusted corporate earnings relative to share prices (the ‘Shiller P/E’2 ), valuations on the US stock market are also at a record high. By contrast, the expected P/E ratio for 2027, based on analysts’ profit forecasts, is at a comparatively moderate, albeit not low, level (Figure 2).

The Shiller P/E ratio is usually higher than expected earnings, as it is inflation-adjusted and future earnings tend to be higher than past earnings, which pushes down the estimated P/E ratio. Furthermore, Wall Street forecasts are traditionally optimistic.
Compared with US shares, the German share index (DAX) is more cheaply valued in terms of both the Shiller P/E ratio and the estimated P/E ratio (Figure 3).

Where price and value still align
Amid the artificial intelligence (AI) boom, the gap between US shares and German blue chips has widened, as Wall Street analysts expect significantly higher profits than in the past, particularly for the heavyweights in the technology sector.3 The tailwind for German companies is considerably weaker, as the potential beneficiaries of AI represented on the DAX carry too little weight overall, or the advantages are not apparent. This disadvantage would then become an advantage if AI were to lead to – or has already led to – a massive overvaluation.
The extent to which an AI bubble has formed that will burst sooner or later is a much-debated question. The estimated P/E ratio in the S&P 500 is well below the levels seen during the telecoms, media and internet stock bubble at the turn of the millennium (the dot-com bubble). And the record-high Shiller P/E ratio will fall should analysts’ profit forecasts prove accurate. A risk arises if companies fail to meet expectations and/or investments are cut back. The fall would then be steep – at least that is what the experience of share price crashes in the last and this century suggests (Greenwood, Shleifer, You 2019). Following the bursting of the dot-com bubble (Ofek, Richardson 2001), the financial crisis and the Covid crash, the Shiller P/E ratio plummeted in tandem with falling share prices. Smaller episodes of price setbacks of around one-fifth in recent years confirm this clear pattern (see Figures 2 and 3).
It should also be noted that, within the technology sector, it is primarily producers of AI hardware that generate exorbitant cash inflows from their operations. For buyers – for example, those in the software sector – these represent capital expenditure (CAPEX)4, which reduces free cash flows or even exceeds them: in such cases, debt is required for financing. In aggregate, cash flow (or cash flow plus cash from additional borrowing) shifts from software to hardware companies; at the cash level, this remains a zero-sum game until the buyers of AI hardware generate additional revenue from their customers beyond their existing business. In addition to looking at profits, investors should therefore pay close attention to the development of free cash flow (FCF).
Differing trends across sectors
This is also reflected across the various sectors. For instance, profit growth in the ‘Communication Services’ sector has been very positive for years. On average, net earnings have roughly quadrupled over the ten-year period from 31 March 2016 to 31 March 20265. Recently, however, free cash flows have been declining – a trend that is likely to continue, according to analysts’ estimates. The sector includes, amongst others, Alphabet and Meta – two of the hyperscalers that each aim to invest hundreds of billions of dollars in AI – per company, per year, up to 2030.6 Even the sector’s current valuation is high, measured by the current price-to-free-cash-flow ratio and the P/E ratio as at 31 March 2027. Six of the 20 companies in the sector are worth further analysis due to valuation metrics that appear sound at first glance. It could be worthwhile to take a closer look here. Earnings growth, cash flows and share valuations collectively paint a positive picture for these companies (Table).7

A total of 112 companies from the S&P 500 have made it onto the shortlist of companies recommended for further analysis. Most of these, both in absolute and relative terms, come from the IT sector: as many as 25 out of 72 could prove to be shares trading at interesting price levels. The sector includes, amongst others, both software companies that have recently been under pressure and high-flying semiconductor firms. However, the sector’s overall valuation is very high, meaning that caution and due diligence are warranted from a fundamental perspective. Only three sectors are currently considered to be moderately valued: Health Care, Consumer Staples and Financials. The financial sector has long encompassed not only banks, but also data providers such as FactSet, rating agencies such as S&P Global, the credit card group Visa and the holding company Berkshire Hathaway. The healthcare sector includes the traditional pharmaceutical and biotech industries (Pfizer, Amgen) as well as, amongst others, medical technology firms such as Medtronic. In healthcare, it may be that generally decent to good business performance has not been sufficiently reflected in share prices recently. At least, that is what the valuation metrics suggest. 14 out of 59 companies in the sector are recommended for individual analysis.
The Consumer Staples sector includes, amongst others, consumer staples such as Coca-Cola and Procter & Gamble. Here, the long-term data and current key figures primarily indicate predictable stability rather than high-flying earnings prospects. One of the four of the 36 companies listed here warrants further analysis at first glance.
The second consumer sector, Consumer Discretionary, is a diverse mix of companies. It includes Amazon, car manufacturers Ford and General Motors, and Domino’s Pizza; valuations are considered high; whilst profit trends are positive overall, free cash flows at sector level are volatile.
The utilities sector is characterized by negative free cash flows and is therefore rather unattractive. ‘Materials’ are considered to be very highly valued at sector level. In the energy sector, high valuations could be a deterrent; at first glance, only 3 out of 26 companies appear to be potentially attractive.
In the financial sector, by contrast, 18 of the 72 companies listed there warrant further analysis. Specialist knowledge and analysis are particularly necessary in this sector, especially for banks, and likewise for property shares (Real Estate). Seven out of 31 companies listed there show a positive trend in ‘Funds from Operations’ (FFO). FFO is a key metric for assessing the cash flow and operational performance of property companies.8
Based on the free cash flow generated over the past twelve financial months, the 112 companies selected show an average return on market capitalization of 4.6 per cent9 at the time of the survey. This is 0.4 percentage points higher than the S&P 500 shares, which did not meet the selection criteria.
The Shiller P/E ratio of the selection is higher than that of the S&P 500 as a whole, but within the selection group it is close to its lowest level in six years. The estimated P/E ratio is one-tenth higher than the average over the past six years and slightly higher than the estimated P/E ratio for the S&P 500 as a whole. The price-to-sales ratio, another valuation metric – albeit not of paramount importance – averages 5.6 (past six years: 6.4/Figure 4).

The group of 112 candidates can be further narrowed down quantitatively prior to a more in-depth analysis. For example: provided that earnings before interest and taxes (Earnings before interest and taxes, EBIT) must have been at least twelve per cent, the estimated price-to-earnings ratios for 2027 and 2028 should not exceed 18, and the free cash flow yield (FCF yield) must have most recently reached at least four per cent, this results in a basket of 23 shares. These stocks exhibit relatively low price-to-sales ratios, with a median of 3.3 (Figure 5).

It is worth noting that the selection of 23 out of 112 shares also includes companies whose valuations are significantly depressed due to AI-related concerns. AI is still a relatively new factor that should be taken into account from a risk-reward perspective during in-depth analysis. Experience suggests that there is likely to be too much euphoria surrounding the (potential) AI winners, whilst a whole host of supposed AI losers may be trading at excessively low levels.
Conclusion
A schematic analysis of S&P 500 companies based on current and near-future valuation metrics shows that sectors outside the mainstream sometimes exhibit moderate valuations. Within each sector, there are companies that might be worth a second look. The approach chosen here cannot capture companies whose potential business success lies far in the future. In any case, the question arises as to what extent it is realistic to estimate revenue and earnings that lie so far in the future. A shorter-term perspective certainly offers greater certainty. The approach has not taken into account the additional need for a balance sheet analysis of the respective companies. For example, the structure of financing on the liabilities side (equity/debt) and the risks or opportunities that assets may entail require individual analysis. For instance, a high proportion of acquisition premiums (‘goodwill’) relative to equity always increases the risk profile of a long-term equity investment (Schürmann 2022). The risk premium at which future earnings should be discounted also varies from company to company. It is quite possible that companies from sectors currently valued at moderate levels may then offer better prospects than those in the IT sector. However, the opposite may also be true.
Short Interview with Christof Schürmann
What is the analysis of stocks outside the mainstream about?
Christof Schürmann: The analysis examines whether there are attractive companies within the S&P 500 beyond the technology and semiconductor stocks that are currently attracting most of the attention. To this end, all eleven sectors are compared on the basis of earnings, free cash flow and valuation metrics. The aim is to identify companies that have performed well but remain relatively overlooked.
Why is it worth looking at companies outside the current artificial intelligence boom?
Schürmann: The strong focus on a small number of large AI and semiconductor companies may mean that fundamentally solid businesses are being overlooked. If investors' attention were to shift towards other sectors, these companies would likely perform relatively better. For that reason, it can be worthwhile to identify and analyse such businesses at an early stage.
Which sectors appear particularly attractive according to the analysis?
Schürmann: The analysis suggests that Health Care, Consumer Staples and Financials stand out for their comparatively moderate valuations. These sectors contain several companies whose earnings performance and other key metrics warrant closer individual analysis. By contrast, some other sectors are valued considerably more highly overall. Even so, they also include companies that may merit a closer look.
Which metrics are particularly important when selecting companies?
Schürmann: The analysis takes into account, among other things, earnings growth, free cash flow, the price-to-earnings ratio, the price-to-free-cash-flow ratio and other valuation metrics. It also emphasises that balance sheet quality, financing and company-specific risks must be assessed. These metrics therefore represent only the first step in the investment analysis.
Which sources were used for the analysis?
Schürmann: The analysis is based on market data from Bloomberg as well as several academic studies on the subject. It also draws on an earlier study by the Research Institute on takeover premiums as a reference.
1 Communication Services, Consumer Discretionary, Consumer Staples, Energy, Financials, Health Care, Industrials, Information Technology, Materials, Real Estate, Utilities.
2 The Shiller P/E ratio (also known as the ‘Shiller PE ratio’ or ‘Cyclically Adjusted Price-to-Earnings (CAPE) ratio’) evaluates a share or an index by comparing the current share price to the average, inflation-adjusted corporate earnings over the past ten years
3 Bloomberg data currently indicates that year-on-year earnings growth of 24.8 per cent/16.8 per cent is expected for the S&P 500 in 2026/2027, and 12.4 per cent/15.1 per cent for the DAX (GAAP in each case, retrieved on 7 July 2026))
4 CAPEX (Capital Expenditure) refers to a company’s investment expenditure on long-term fixed assets. Such expenditure – for example, on IT or machinery – does not usually have an immediate impact on profit (i.e. it reduces profit). Companies capitalise CAPEX on their balance sheet and depreciate it on a straight-line basis over its useful life. Depreciation charges then reduce profit; however, they are added back in the same amount in the cash flow statement, meaning that, on balance, they are cash-neutral over the depreciation period
5 31 March is the most common quarterly reporting date for S&P 500 companies; however, other reporting dates, such as 28 February, are also included and recorded accordingly
6 The companies named in this paper are provided as examples for illustrative purposes only. None of them constitutes an investment recommendation
7 The approach is schematic and quantitative. Consequently, lucrative business models may be overlooked
8 FFO adjusts net profit by adding back depreciation and amortisation whilst deducting gains from property sales and interest income, in order to reflect the actual operating result
9 Some financial stocks, such as banks and property shares, were not taken into account
_______________________________________________________
References
Arbel, A., Carvell, S., Strebel P. (1983), “Giraffes, Institutions and Neglected Firms”, Financial Analysts Journal Volume 39, Issue 3
Greenwood, R., Shleifer, A., You, Y. (2019), “Bubbles for Fama”. Journal of Financial Economics 131, no. 1: 20-43.
Ofek, E., Richardson, M. (2001), DotCom Mania: “The Rise and Fall of Internet Stock Prices”, Working Paper 8630, DOI 10.3386/w8630
Pástor, Ľ., Veronesi, P. (2009), "Technological Revolutions and Stock Prices" American Economic Review 99 (4): 1451–83.
Schürmann, C. (2022), „Goodwill - the genie is still in the bottle“, Flossbach von Storch Research Institute

About the author
Senior Research Analyst. Graduate business economist (FH). Previously a journalist and deputy head of ‘Money’ at WirtschaftsWoche. Book author (‘Die Bilanztrickser’) and lecturer at the private university BiTS in Iserlohn (accounting research).



Legal notice
The information contained and opinions expressed in this document reflect the views of the author at the time of publication and are subject to change without prior notice. Forward-looking statements reflect the judgement and future expectations of the author. The opinions and expectations found in this document may differ from estimations found in other documents of Flossbach von Storch SE. The above information is provided for informational purposes only and without any obligation, whether contractual or otherwise. This document does not constitute an offer to sell, purchase or subscribe to securities or other assets. The information and estimates contained herein do not constitute investment advice or any other form of recommendation. All information has been compiled with care. However, no guarantee is given as to the accuracy and completeness of information and no liability is accepted. Past performance is not a reliable indicator of future performance. All authorial rights and other rights, titles and claims (including copyrights, brands, patents, intellectual property rights and other rights) to, for and from all the information in this publication are subject, without restriction, to the applicable provisions and property rights of the registered owners. You do not acquire any rights to the contents. Copyright for contents created and published by Flossbach von Storch SE remains solely with Flossbach von Storch SE. Such content may not be reproduced or used in full or in part without the written approval of Flossbach von Storch SE.
Reprinting or making the content publicly available – in particular by including it in third-party websites – together with reproduction on data storage devices of any kind requires the prior written consent of Flossbach von Storch SE.
© 2024 Flossbach von Storch. All rights reserved.