16.02.2022 - Studies

Not every revolutionary is well-known. Outside the world of finance, John Bogle, for example, is hardly familiar to anyone. But what the economist, born in 1929, has in common with many much more popular revolutionaries: Failure before the breakthrough. At the age of 37, his employer at the time, Wellington Management, dismissed him after a bad investment. Whether this spurred Bogle on to develop a big idea is not certain. In any case, he founded the Vanguard Group in 1975. One year later, he offered a product that was to revolutionise the financial world: an index fund (Exchange Traded Fund/ETF) on shares. With the Vanguard 500 Index Fund, he sold investors for the first time a portfolio on stocks that did not select the securities, but rather represented an entire market - and which, because of the broad diversification, was supposed to reflect the corporate landscape well in an investor's portfolio and open up balanced stock market opportunities. Instead of looking for the needle in the haystack, Bogle simply took aim at the whole haystack.
However, it took time before the concept attracted attention in the financial world. Index funds initially eked out a niche existence. In 1990, the first exchange-traded fund was launched on the stock exchange. But even in 2005, providers worldwide managed only 417 billion dollars in 453 products. Today, however, it is hard to imagine an investment product without ETFs. Their rise has continued even during the pandemic. Today, Bogle's idea is feeding a multi-billion dollar industry, with assets under management of more than ten trillion dollars at last count.
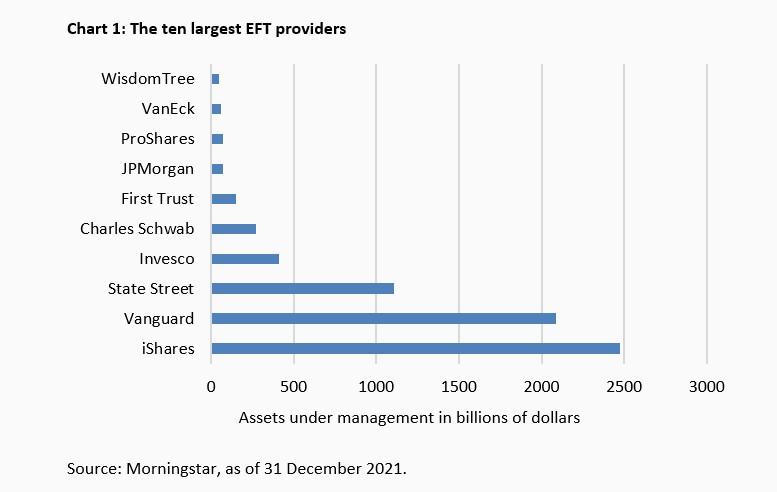
"Index investing" is highly scalable and opens up enormous economies of scale for providers. This promotes concentration. Only ten providers account for two-thirds of the capital under management. Pioneer Vanguard is still at the forefront, but has since been overtaken by iShares, a subsidiary of the US asset manager Blackrock. Together with New York-based State Street, the top three manage more than half of all ETF assets (chart 1).
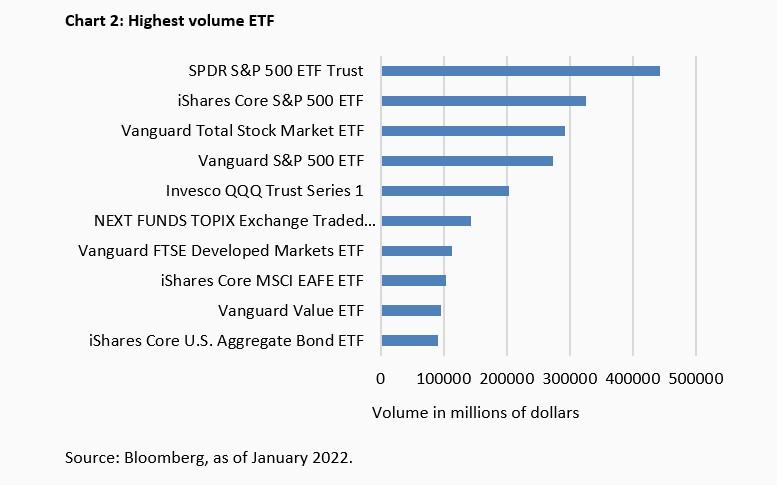
The US indices in particular have a pull effect on equity ETFs. Three of the world's four largest ETFs reference the S&P 500 and gather $1.04 trillion in assets under management - around ten percent of total ETF assets. Also number three and number five by assets are US equity products. The Vanguard US Total Stock Market ETF manages just over $292 billion, while the Invesco QQQ Trust Series 1, which has the Nasdaq 100 as its benchmark, manages just over $204 billion. More than every seventh dollar invested in ETFs worldwide is stashed away in these five products (chart 2).
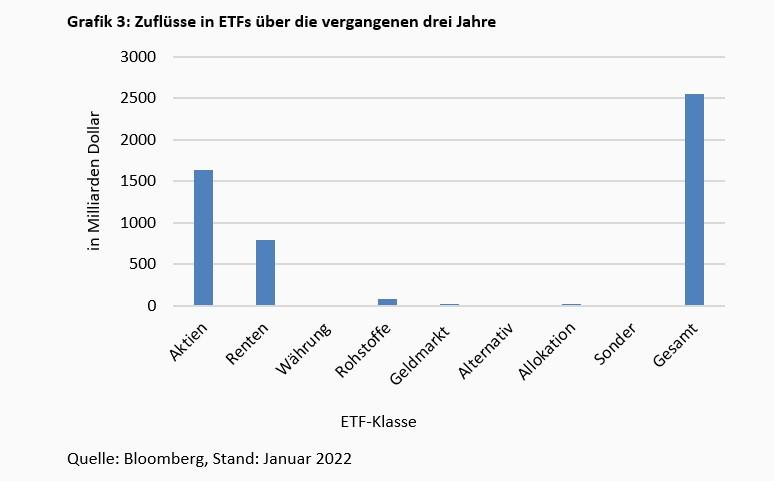
Away from these heavyweights, investors now come across a sea of ETFs. Strong marketing has led to the number of ETFs now exceeding 11,000 products - several 24times more than 17 years ago. In 2021 alone, the net increase in the number of products was 12.6 percent. Inflows are not growing quite as strongly - investors are spreading their money over more products. Over the past three years, ETFs received $2.55 trillion across all asset classes, a 33.9 percent increase, or an average of 10.2 percent per year (chart 3).
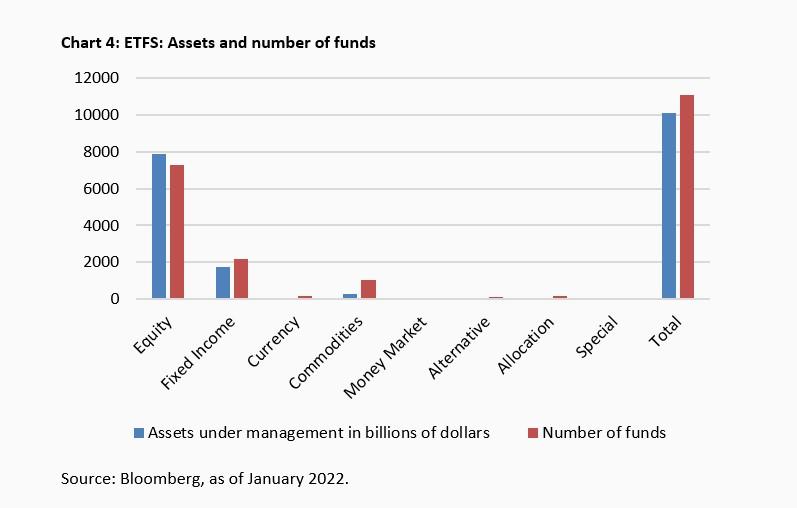
Equity products attracted the bulk of fresh funds with a good 1.6 trillion dollars. Bond ETFs recorded an inflow of funds of a good 787 billion dollars over the three years under consideration. Equity ETFs also dominate the portfolio by far with almost eight trillion dollars (chart 4).
With $43.8 trillion in assets under management, active managers are still generally ahead of ETFs, but investors here prefer money market and bond funds in particular. In equities, ETFs recorded inflows, while actively managed equity investment funds lost around $400 billion on balance in 2020 and 2021. Investors are thus increasingly concentrating their equity investments in ETFs.
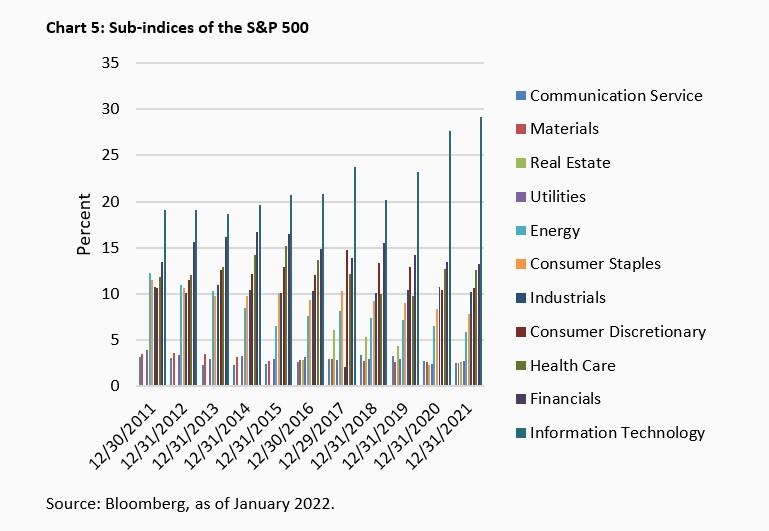
Contrary to the original intention, investors in supposedly broadly diversified index funds no longer achieve the diversification of their investments that was actually intended. Instead, the most popular funds are now concentrated on technology stocks. For example, the share of these stocks in S&P 500 ETFs is just under 30 percent, after their share has increased by about half in the past ten years (chart 5).
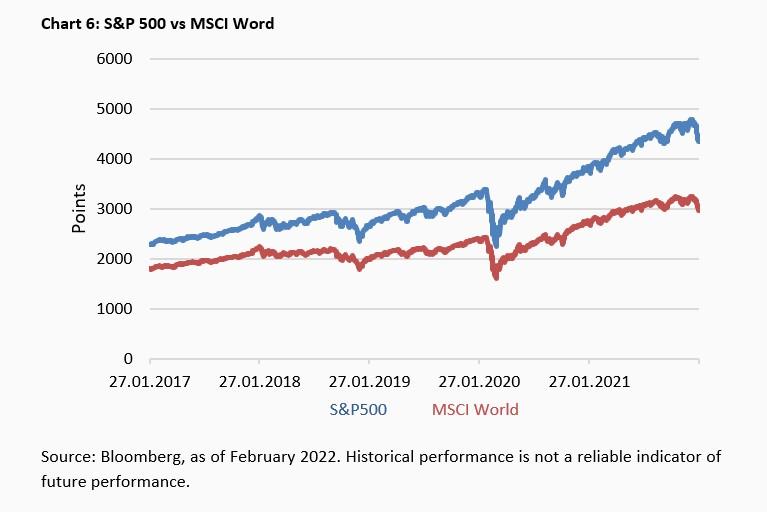
In the MSCI World, which supposedly encompasses the global investment universe, the share of technology stocks was also close to 28 per cent at the end of 2021. Consequently, the price curves of an ETF on the MSCI World and an ETF on the S&P 500 ran almost parallel over the past five years, with the US index outperforming the world index by five percentage points annually with an annual increase of 17.2 percent compared to 12.2 percent (chart 6).
If you delve even deeper into the indices underlying the ETFs, you will find even more astonishing concentrations. Seven companies dominate the index world: Apple, Microsoft, Amazon, Tesla, Alphabet - Class A and Class C -, Meta and Nvidia. In the entire S&P 500 with its latest 505 shares, the ‘Glorious Seven’ account for a good 26 percent of the largest US stock index by market capitalisation. In the US total stock market, which is supposedly even broader than the S&P 500, their concentration is 22,2 percent only slightly lower. In the Nasdaq 100 and ETFs based on it, their weight was recently as high as almost 49 percent.
Attentive observers might now critically note that the aforementioned top five heavyweights among all ETF products reference US indices. That is true. But a look at much broader indices hardly dilutes this concentration. The index provider MSCI, for example, tracks 85 percent of the world market capitalisation with its world index on 23 stock exchanges of the developed countries with a total of 1546 stocks. Despite its supposed breadth, the index, which will be worth a good 62 trillion dollars in market capitalisation by the end of 2021, contains 69 percent of US stocks. The ‘Glorious Seven’, on the other hand, have long since taken over the MSCI World, with a weighting of 17.6 percent. By way of comparison, this corresponded to more than five times the value of all 40 Dax companies at the end of 2021.
Even in the MSCI ACWI, which has been expanded by MSCI World to include 25 emerging markets and thus a further 1420 shares, the weight of the seven dominators is still at 15,6 percent. The 2958 other stocks share the rest and have an average weight of less than 0.03 percent. The median weight of all stocks in an iShares ETF on the MSCI ACWI is a meagre 0.01 per cent. Anyone who thinks that this includes small companies from the niches of the stock market is mistaken: such a low weighting includes a Dax company such as the cosmetics manufacturer Beiersdorf or the Russian oil company Rosneft, which was recently ranked 194th in the Fortune Global 500 list.
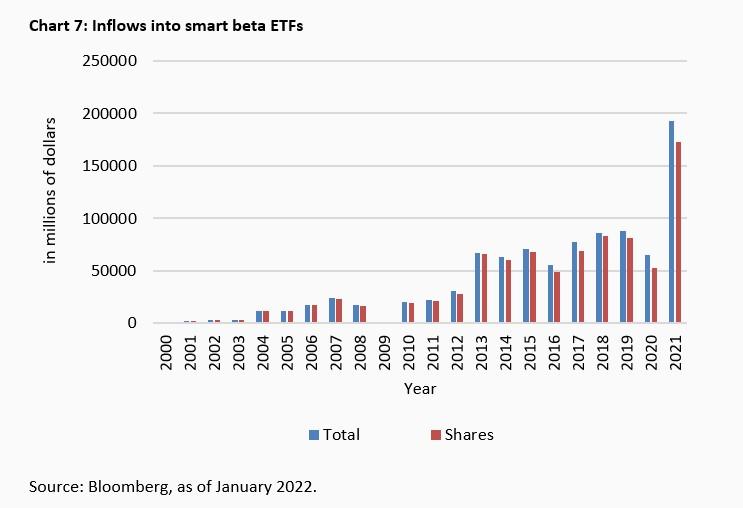
Although they contradict the very idea of "passive investing" in principle, so-called smart-beta ETFs also remain on the rise. At a good 192 billion dollars, almost every sixth dollar newly invested in ETFs in 2021 was in the smart beta class - a record inflow (chart 7).
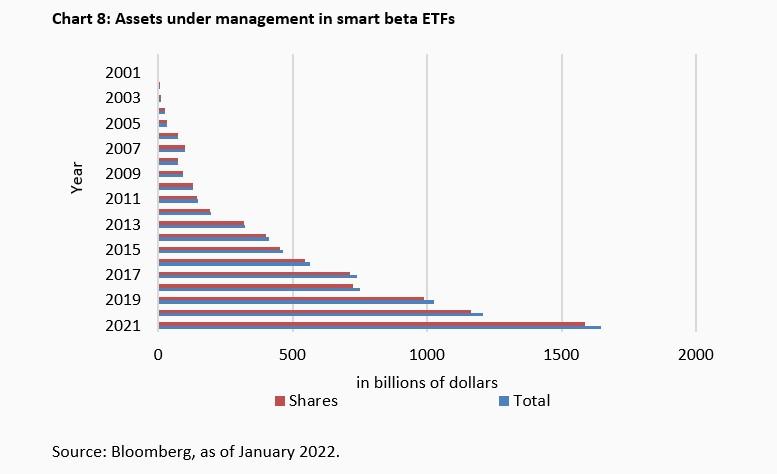
At a good $1.6 trillion, smart beta ETFs now represent around 16 percent of the total ETF market (chart 8). For equity-related ETFs, the share is even around one-fifth of all equity ETFs.
Smart beta ETFs counteract Bogle's original idea: they select securities from the population of a market according to fundamental factors such as the volatility of share prices or dividend payments of companies. The result can be seen in the example of the $80 billion Vanguard Growth ETF, the second largest ETF in the smart beta universe. Instead of "only" 17.6 percent as in the MSCI World, the Glorious Seven have a weighting of 45.4 percent in the portfolio here.
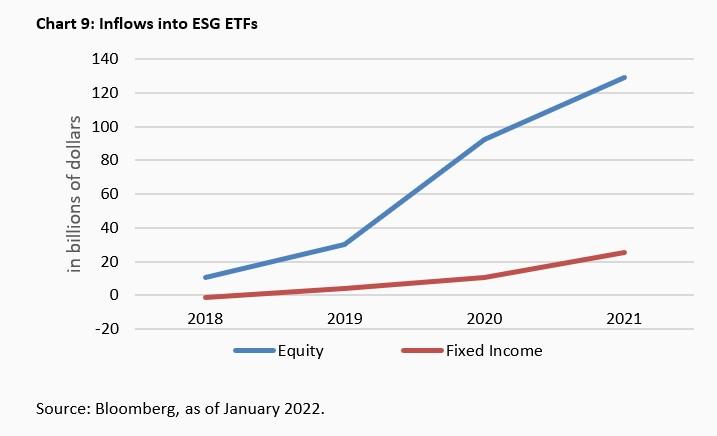
Not always in a class of their own, but sometimes found under smart beta, sometimes under eco-ETFs, are ESG funds trimmed to "sustainable investments". Here, too, demand is growing enormously. While only just under eleven billion dollars flowed into ESG ETFs in 2018, this figure had already risen to a good 156 billion dollars by 2021 (Chart 9).
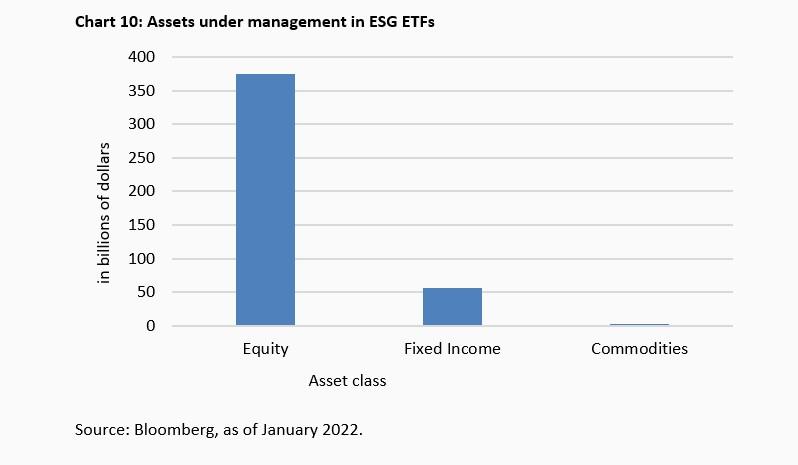
Managers of ESG equity ETFs most recently held nearly $375 billion in assets - close to five percent of all equity ETFs (chart 10).
But even with the label climate protection, good corporate governance and social production, the diversification of the portfolio does not really improve. At 23 percent, for example, the share of the Glorious Seven in the largest ESG ETF by assets under management, the $23.5 billion iShares ESG Aware MSCI USA ETF, is simply about three percentage points lower than in a classic S&P 500 ETF or just under one percentage point above the third-largest ETF overall (US Total Stock Market ETF). The "sustainable" ETF is thus only a small variation on its bigger brother, which does without climate and social criteria. And those who want to differentiate themselves regionally from the US or a US-like world investment are again primarily buying into technology. In the $6.2 billion iShares ESG Aware MSCI EM ETF, for example, the share of a semiconductor company alone accounts for a good 7.9 percent. The top six positions are held by Asian tech companies with a total weight of 22.1 percent.
"Never be completely in, but also never be completely out of the market" - this advice was given by John Bogle at the age of 89 in one of his last interviews in September 2018. Every investor should be exposed to equities according to his or her feel-good quota, and not desist from this even in the case of strong price fluctuations. However, his original idea of using an exchange-traded fund to invest in a broad universe, and thus possibly less volatile or risky, can hardly be realised anymore. The universe of ETFs is dominated by an almost unmanageable number of products focused on particular themes or areas. And those who want to buy the "whole stock market", for example, often go astray. Because even in the equity ETFs that supposedly map the global market, a few individual stocks now have a high weighting. There are two main reasons for this: First, the ETF industry has managed to seduce customers back into "active" investing. For this "active" management, the fee bill is naturally higher. Secondly, the prolonged low interest rate policy of the central banks has shifted market capitalisation towards low, interest-sensitive technology companies. Those who are seen as investing "passively" today are buying a few big needles in a fairly small haystack.


Legal notice
The information contained and opinions expressed in this document reflect the views of the author at the time of publication and are subject to change without prior notice. Forward-looking statements reflect the judgement and future expectations of the author. The opinions and expectations found in this document may differ from estimations found in other documents of Flossbach von Storch SE. The above information is provided for informational purposes only and without any obligation, whether contractual or otherwise. This document does not constitute an offer to sell, purchase or subscribe to securities or other assets. The information and estimates contained herein do not constitute investment advice or any other form of recommendation. All information has been compiled with care. However, no guarantee is given as to the accuracy and completeness of information and no liability is accepted. Past performance is not a reliable indicator of future performance. All authorial rights and other rights, titles and claims (including copyrights, brands, patents, intellectual property rights and other rights) to, for and from all the information in this publication are subject, without restriction, to the applicable provisions and property rights of the registered owners. You do not acquire any rights to the contents. Copyright for contents created and published by Flossbach von Storch SE remains solely with Flossbach von Storch SE. Such content may not be reproduced or used in full or in part without the written approval of Flossbach von Storch SE.
Reprinting or making the content publicly available – in particular by including it in third-party websites – together with reproduction on data storage devices of any kind requires the prior written consent of Flossbach von Storch SE.
© 2024 Flossbach von Storch. All rights reserved.

Christof Schürmann
Senior Research Analyst
At the Institute since 2022. The graduate in business administration (FH), previously worked as a journalist and deputy head of "Money" at WirtschaftsWoche. The trained banker and book author ("Die Bilanztrickser") taught balance sheet research part-time at the private university BiTS in Iserlohn.
All articles by Christof Schürmann