06.10.2023 - Comments

Currently, the Magnificent 7 and the S&P 493 are getting a lot of attention. The Magnificent 7 are the currently largest seven U.S. stocks (Alphabet, Amazon, Apple, Meta, Microsoft, Nvidia and Tesla). Without the Magnificent 7, the year-to-date performance of the S&P 500, also called the S&P 493, shrinks from ten percent to zero, as the seven stocks have already gained more than 50 percent in value-weighted terms this year.
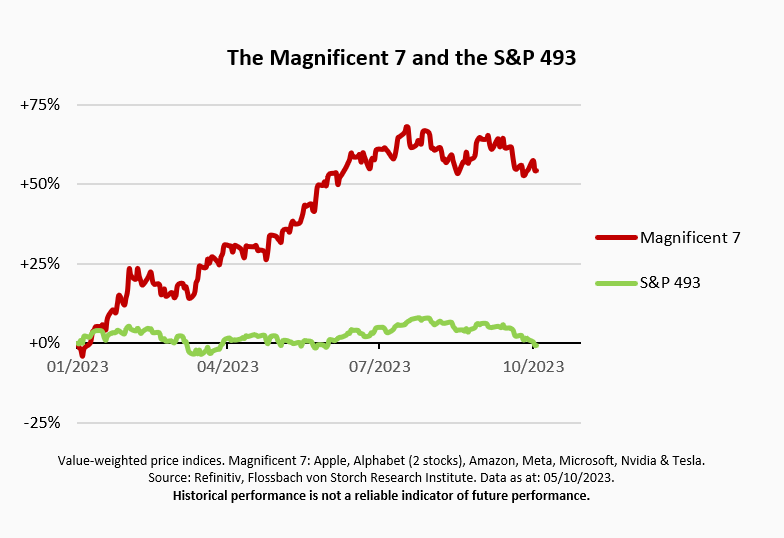
The fact that value creation and performance are concentrated on stock markets is nothing new. This year, however, the concentration seems to be particularly high.
The chart below shows from left to right the performance (year-to-date, based on prices) of portfolios containing only the largest companies in terms of their stock market value at the beginning of the year. The first portfolio on the far left consists only of Apple stock, the largest stock at the beginning of the year. The second portfolio contains Apple and Microsoft on a value-weighted basis, and so on, until finally the last portfolio on the far right comprises all shares of the S&P 500.
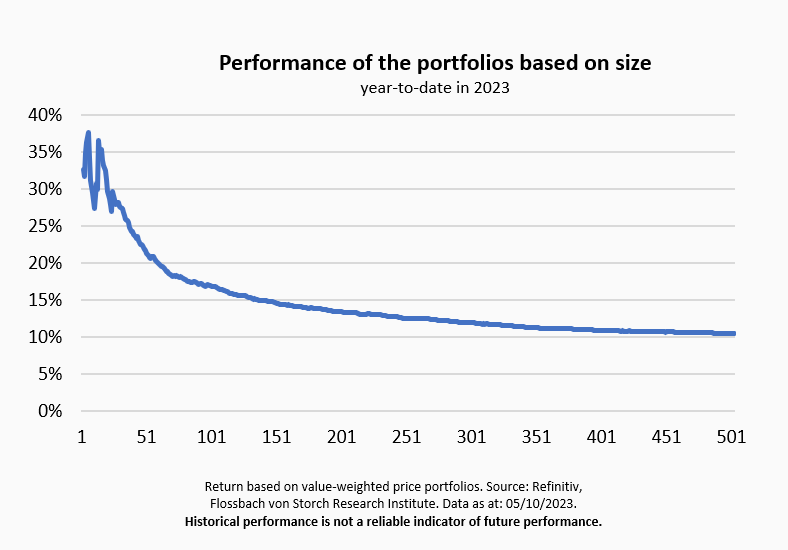
In fact, investing only in the largest stocks would have been a very profitable strategy for this year so far. While it was possible to generate returns of over 30 percent with just a few stocks, even the portfolio with the 50 largest stocks yielded a return of over 20 percent year-to-date, well above the performance of the overall index.
Arguably, the Magnificent 7 were not exactly the seven largest stocks at the beginning of the year. An investor focused solely on size would not have been able to identify them that way at the beginning of the year. As a result, none of the portfolios in the chart above reach the 50% return of the Magnificent 7. However, all seven stocks were among the 24 largest stocks at the beginning of the year.
For the first nine months of 2023, the narrative that big stocks outperform is working just fine. But would it have worked last year as well?
For the year 2022, size was also a very good sign for performance - only unfortunately the correlation was inverse. While the S&P 500 ended the year down just under -20 percent, the portfolio of the seven largest stocks plunged -40.1 percent. The seven stocks listed above were exactly the seven largest stocks at the start of 2022 and also the seven biggest losers of the year. So, anything but "magnificent."
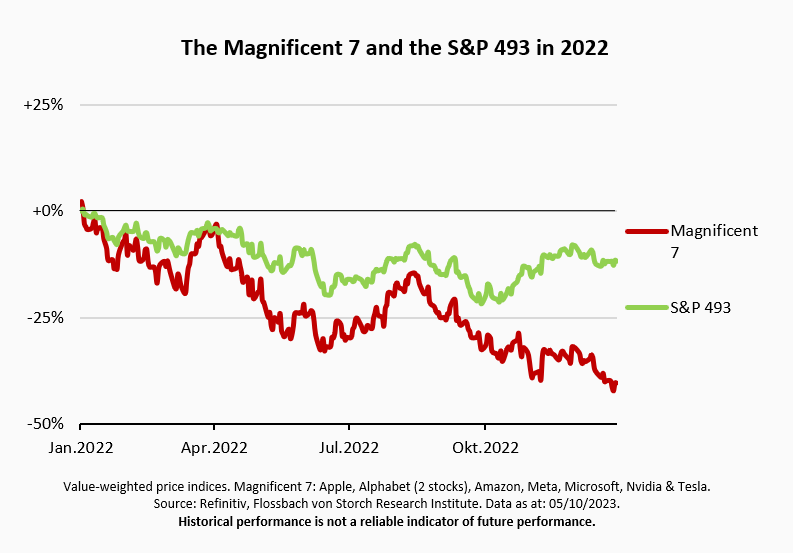
High positive returns, on the other hand, were particularly to be found among mid-cap and small caps. In fact, adding more stocks could almost only have improved performance. The eighth largest stock at the beginning of 2022 (UnitedHealth Group) ended the year with a performance of plus five percent.1
The narrative of the Magnificent 7 and the S&P 493 fits the current year perfectly and is wind in the sails of investors who pick their stocks based on market value, as is the case with ETFs that replicate indices. Only, unfortunately, this is a snapshot and likewise a backward-looking view. A look back shows that the wind can just as easily shift and speak against the narrative. Similar narratives about equity groups occur again and again. Not long ago, for example, the notion of FAANG2 stocks made the rounds. The shares of Tesla and Nvidia were not in focus at the time because they had not yet generated their performance, but Netflix was among the select group.
This brief analysis shows that the selection of stocks for a portfolio should not be based solely on the stock market value and that backward-looking considerations can quickly be misleading. If other factors are considered that provide information on the quality and future earnings power of a company, there are more opportunities to control and improve the performance and risk-return ratio of a portfolio.
1 Historical performance is not a reliable indicator of future performance.
2 FAANG: Facebook (now Meta), Apple, Amazon, Netflix, Google (now Alphabet).


03.03.2021 - Companies
Legal notice
The information contained and opinions expressed in this document reflect the views of the author at the time of publication and are subject to change without prior notice. Forward-looking statements reflect the judgement and future expectations of the author. The opinions and expectations found in this document may differ from estimations found in other documents of Flossbach von Storch SE. The above information is provided for informational purposes only and without any obligation, whether contractual or otherwise. This document does not constitute an offer to sell, purchase or subscribe to securities or other assets. The information and estimates contained herein do not constitute investment advice or any other form of recommendation. All information has been compiled with care. However, no guarantee is given as to the accuracy and completeness of information and no liability is accepted. Past performance is not a reliable indicator of future performance. All authorial rights and other rights, titles and claims (including copyrights, brands, patents, intellectual property rights and other rights) to, for and from all the information in this publication are subject, without restriction, to the applicable provisions and property rights of the registered owners. You do not acquire any rights to the contents. Copyright for contents created and published by Flossbach von Storch SE remains solely with Flossbach von Storch SE. Such content may not be reproduced or used in full or in part without the written approval of Flossbach von Storch SE.
Reprinting or making the content publicly available – in particular by including it in third-party websites – together with reproduction on data storage devices of any kind requires the prior written consent of Flossbach von Storch SE.
© 2024 Flossbach von Storch. All rights reserved.