
By the middle of 2024, asset price inflation for private households in Germany was -0.7 %. While there was a slight price decline in a twelve-month comparison, asset prices rose in both the first (+0.5 %) and second quarter (+0.8 %) of 2024. This indicates an end to the price decline that began two years ago.
The reason for the stop in the fall in prices is to be found in the development of key and market interest rates in Europe and the USA. Both interest rate expectations and interest rate trends have changed in the last twelve months. While high consumer price inflation led to expectations of rising interest rates in mid-2023, consumer price inflation continued to flatten out in both the US and Europe, leading to falling interest rates in Europe. This in turn had an impact on the prices of various assets, halting the fall in prices on the asset markets.
The Flossbach von Storch (FvS) Wealth Price Index measures the price development of the assets held by German households. The index corresponds to the weighted price development of real and financial assets owned by German households. Real assets consist of real estate (64%) and business wealth (12%) as well as consumer durables (3%) and collectibles and speculative items (<1%). Financial assets are broken down into savings and demand deposits (10 %), shares (5 %), bonds (5 %) and other financial assets (<1 %). A detailed description of the methodology can be found in the appendix.
At mid-year, the price of real assets (real estate, business wealth, durable consumer goods and collective and speculative items) held by German households was -2.0% lower than in the same quarter of the previous year. However, there were different price trends within real assets.
A trend reversal has become apparent on the German real estate market. Based on the vpdResearch price indices, the two-year decline in prices on the German real estate market is coming to an end. Although the property assets of private German households were trading at -3.4% lower prices at mid-year than in the same quarter of the previous year, there was a slight price increase of +0.5% compared to the previous quarter.
The development of key and market interest rates is the most important factor for the development of real estate prices, as they determine financing costs. It therefore stands to reason that the prospect or realization of falling interest rates has led to an increase in demand for real estate.
Prices for private business wealth (companies owned by private households) rose by +7.2% at the mid-year point compared to the middle of the previous year. There was a slight price increase in the second quarter of 2024, which is attributable less to the gloomy economic outlook and more to interest rate trends.
Price increases for consumer durables continued to slow over the past four quarters. Durable consumer goods only increased in price by +1.4% compared to the same quarter of the previous year. This means that for the first time since 2020, the price increase is back in line with the ECB's monetary policy target.
By the middle of the year, the price of collective and speculative items was just below the previous year's level (-2.6%). One reason for the sideways movement is low demand on the markets for art and historic automobiles.
Expectations regarding the development of interest rates in Europe and the USA have supported the prices of financial assets (savings and sight deposits, shares, bonds and other financial assets) over the past four years. Compared to the end of the previous year, prices for financial assets owned by private households have risen by 4.3%. The most significant share of the price increase already occurred in Q4-2023 and Q1-2024. Within the most recent quarter Q2-2024, there was a price change of only +0.7%.
The equity assets of private German households have increased in value by +13.9% compared to the middle of the previous year. However, only 1.8 percentage points of this is attributable to the second quarter of 2024. The reason for this is that expectations about the future development of interest rates had already formed in the first quarter and caused prices to rise. The most recent price fall at the beginning of August 2024 is not included in the price trend, as the relevant time window only extends to the end of June 2024. If the price drop in the first week of August is taken into account, the price trend over twelve months would only amount to +7.4 %.
On the bond markets, the expectation and development of key interest rates in Europe and the USA also had an impact on prices. Bond prices were +1.4% higher at mid-year than in the previous year. While expectations about the future development of interest rates were already formed in the fourth quarter of 2023, the actual development in the first half of 2024 only had a minor impact on prices. In the most recent past quarter Q2-2024, prices for bonds fell by -0.5 %.
The price of other financial assets, which is measured by the price of gold and commodities traded on the stock exchange, rose by +16.7% compared to the end of the previous year. This development was driven by the price of gold, which rose by 8.7% in Q2-2024 alone. Over the past twelve months, this resulted in a price increase of 20.5%.
The prices for savings and sight deposits remain unchanged by definition.
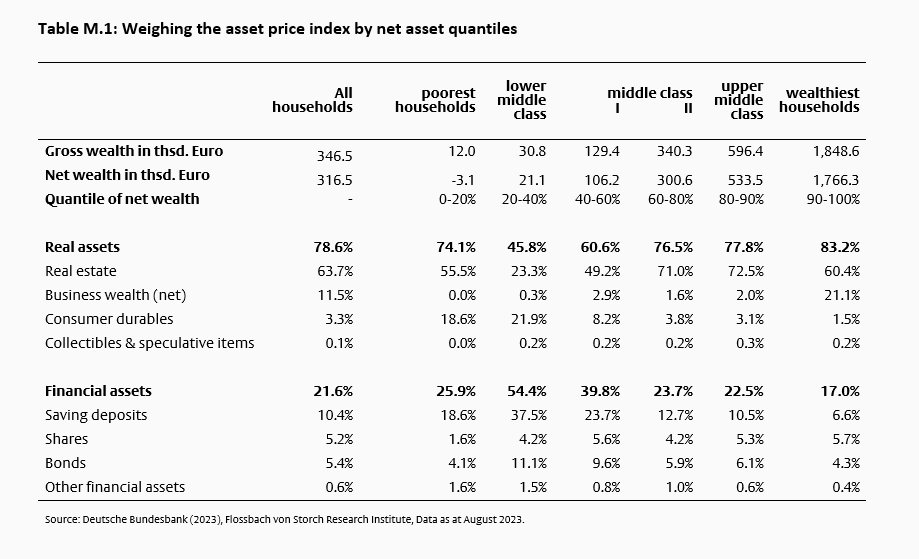
In the cross-section of the net wealth of private German households, asset prices have fallen for all groups with one exception. The wealthiest 60 % to 90 % of households according to their net wealth quantile experienced the highest price decline (-2.2 % to -2.3 %), as they own the highest proportion of real estate assets. For the wealthiest 10%, the price decline was slightly lower (-0.6%), as the high proportion of business wealth dampened the price decline. For households in the lower middle class (20% to 40%), the fall in prices was even slightly positive due to the low level of real estate assets and the high proportion of savings.
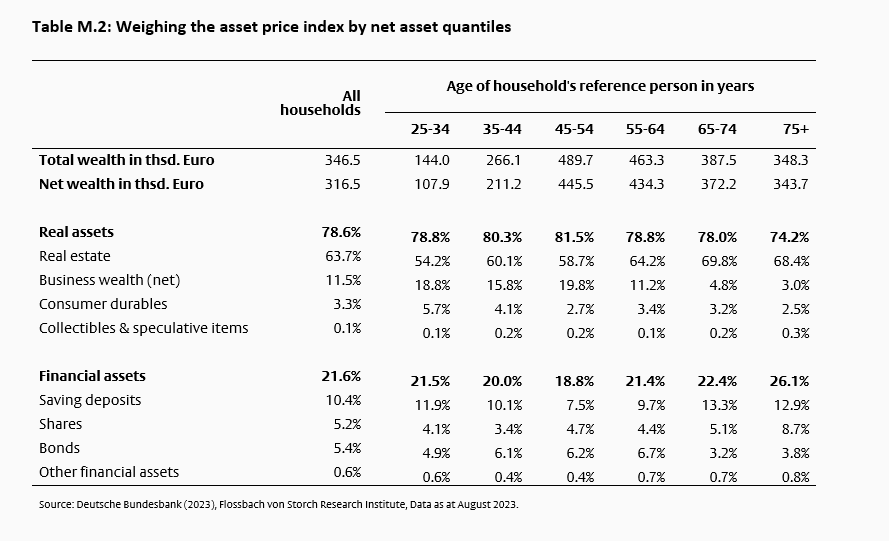
In the cross-section of household ages (measured by the age of the household's reference person), the price decline is between -1.2 % and 0.0 %. The highest value is to be found for the youngest households, while households over retirement age suffered the sharpest fall in prices due to their high proportion of real estate assets.
Momentum on the markets for consumer goods has weakened further. At mid-year, consumer prices were +2.3% higher than in the middle of the previous year. Producer prices also lost momentum, with prices falling by just -2.4% by the middle of the year.
The FvS Wealth Price Index measures the price change of assets held by German households. The index is calculated using the Laspeyres method as a weighted average of time series of indexed prices which reflect the change in the prices of assets in euro. The index is based on the average for the year 2021. Where necessary, quality-adjusted time series have been used and gains, such as interest payments, have not been taken into account. There is no valuation approach employed. For the asset class shares, for example, the share prices and not the price-earnings ratio are taken into account. This corresponds to the procedure for commodity price indices, in which only commodity prices and not the price-utility ratio are included.
The relevant assets are selected via the study "Private Haushalte und ihre Finanzen" (PHF) of the Deutsche Bundesbank (2023). The weighting scheme of the time series is based on the survey results of the 2021 PHF study and corresponds to the share of assets in the total assets of German households. The composition of household assets in the cross-section of the population across wealth and the age of the household members is very heterogeneous. Therefore, the FvS Wealth Price Index is additionally calculated for different quantiles of the distribution of net wealth of German households (total wealth less liabilities) and for different age groups (measured by the age of the reference person of the household).
The assets of a household are divided into various sub-groups of real assets and financial assets. Real assets include real estate, business wealth (net), consumer durables, and collectors' and speculative items. Financial assets include savings deposits, shares, bonds and other financial assets. Assets in the form of funds units and credit balances under cash value insurance contracts are allocated to the aforementioned components according to their respective composition.
The price development of real estate assets is recorded by the VDP real estate price indices of vdpResearch GmbH. For owner-occupied residential property, the "owner-occupied homes" and "owner-occupied apartments" indices are weighted accordingly. For other properties, the development of the capital value of apartment buildings, office properties and retail properties is used and weighted accordingly. For indices that are only available during the year from 2008 onwards, quarterly values prior to 2008 are approximated using average annual growth. The resulting price index for real estate assets corresponds to the indices for owner-occupied and other properties weighted according to the distribution of assets.
Private business wealth comprise all non-publicly traded participations of private households. The price development is approximated by the SDAX price index of Deutsche Börse, which records prices for medium-sized companies. The SDAX price index reflects the price development of 50 publicly traded companies in traditional industrial sectors that follow the MDAX-listed stocks in terms of market capitalisation and stock exchange turnover.
In order to measure the price development of durable consumer goods such as vehicles and furniture, the corresponding components of the consumer price index are used by destatis (Federal Statistical Office). The relative weighting is based on the respective weight in the consumer price index.
The price development of collectors' and speculative items is measured equally by the four representative goods categories jewellery, artworks, historical automobiles and precious wines. Jewellery prices are measured using the "Schmuck aus Edelmetallen" component of the consumer price index. The Artprice Global Index from Artprice.com is used to track price developments on the art market. This price index is based on auction prices for paintings, sculptures, drawings, photographs, prints, aquarelles and similar items. The HAGI Top Index of the Historic Automobile Group International (HAGI) is used to measure the prices of historic automobiles. The index tracks the price development of 50 rare historical automobile types based on a database of transactions covering more than 18,000 individual vehicles. Quarterly values prior to 2009 are based on an equally weighted recalculation interpolating during the year. The price development of precious wines is measured with the Liv-ex Fine Wine 100 published by the trading platform Liv-ex Ltd. The index measures the price development of the premium segment of the wine market for wines for which a secondary market exists. The index primarily includes Bordeaux wines, but also wines from the wine growing regions of Burgundy, Rhône, Champagne and Italy.
Since saving/sight deposits are not subject to a price directly, they are assumed not to show any price changes and are therefore modeled by a constant time series. This category includes, inter alia, current, savings, fixed-term and call money accounts, balances on building savings and non-governmental pension contracts and claims on other households.
The price development of shares is recorded by various share price indices. Using data from the Coordinated Portfolio Investment Survey (CPIS) of the International Monetary Fund (IMF), the geographical weighting of German equity investments is determined and, based on this, MSCI price indices are weighted accordingly.
Similar to the procedure for equity investments, the geographical distribution of bond investments is determined using data from the IMF and the Bank for International Settlements (BIS). The price development is calculated using the corresponding bond price indices from Barclays Bank PLC. Both government and corporate bonds with different credit ratings and residual maturities are taken into account.
Other financial assets, which are not covered by the three previous categories, are measured by the development of gold and commodity prices. The Rogers International Commodity Index is used for the price development of commodities, which reflects the price development of futures on various commodities. The price of gold is determined via the London Bullion Market.
The capital, which is bundled in insurance contracts and funds, is allocated on the basis of data provided by the German Insurance Association (GDV) and the Federal Association for Investment and Asset Management (BVI).
In the case of time series with daily values, the average end-of-day index status of the last quarter month is always used. For indices available monthly, the last monthly value in the quarter is used.
Revision of historical data of the underlying time series may result in a deviation of the historical index values from previous publications.
Publication dates
The index values of a quarter are published as follows:
First quarter: 15 May
Second quarter: 15 August
Third quarter: 15 November
Fourth quarter: 15 February of the following year
If the date falls on a weekend or a public holiday, publication will take place on the next working day.
List of data sources
Art Market Research Developments Ltd.
Bank für Internationalen Zahlungsausgleich (BIZ)
Barclays Bank PLC
Bundesverband Investment und Asset
Management (BVI)
Deutsche Bundesbank
destatis – Statistisches Bundesamt
Gesamtverband der Deutschen Versicherungswirtschaft (GDV) e.V.
Historic Automobile Group International (HAGI)
Internationaler Währungsfonds (IWF)
Liv-ex Ltd
ThomsonReuters
vdpResearch GmbH