31.03.2021 - Studies

The rapid growth of fixed income passive investments in the recent years raises the question of their performance relative to active investment strategies.
In this study, we analyse the performance of actively managed global bond funds over the period 2010 to 2020, comparing the performance of a broad sample of funds with the Bloomberg Barclays Multiverse Index, which is designed to represent the performance of passive instruments. On average, active bond managers and the index are roughly on par. However, the distribution of returns shows that some of the managers included are successful in beating the index frequently.
The discussion about the superiority of active investment approaches over passive ones has maintained its relevance over the past few years (Easley et al. 2020, Kula et al. 2017, Hougan, 2016). The strong growth in volume and the growing variety of passive products, especially in the area of exchange traded funds (ETFs), suggest that investors are increasingly doubtful that active managers are actually capable of outperforming the broad market on a sustained basis through the targeted selection of securities. While initial interest in this context focused on equity ETFs, the increasing absolute and relative importance of bond ETFs has broadened the scope of the discussion to include the bond market (Rhodes and Mason 2019, Stankevičienė and Petronienė 2019).
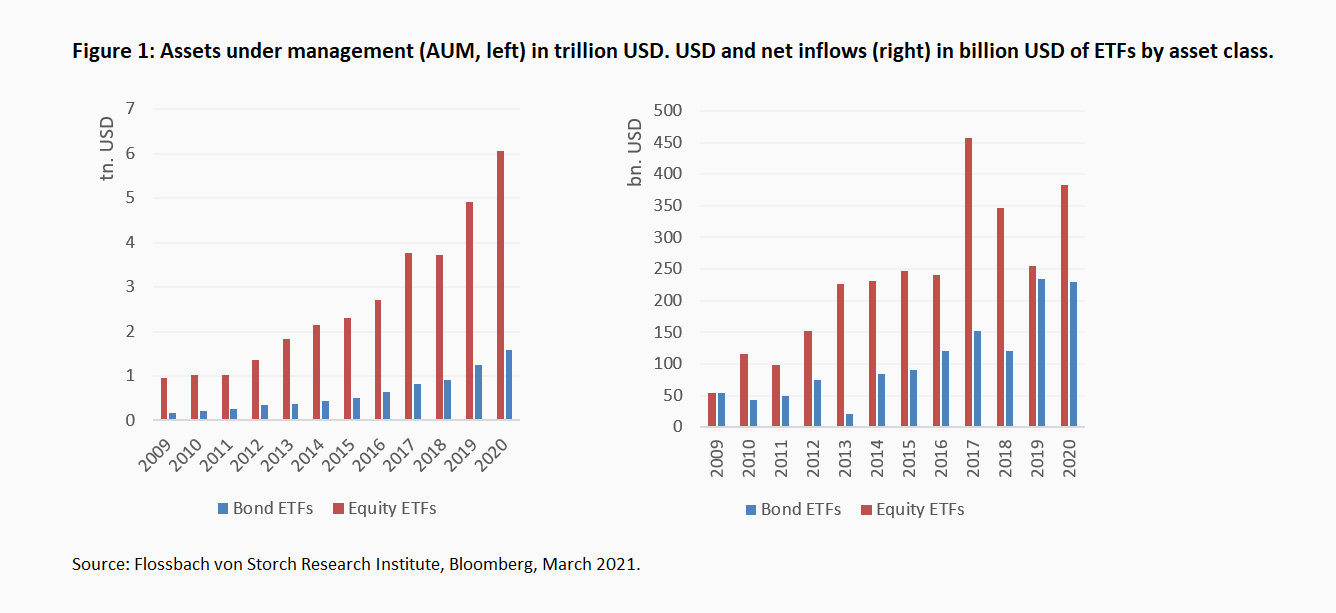
As Figure 1 shows, at the end of 2020 there were about 1.6 trillion USD invested in bond ETFs worldwide. Although this class of securities has far fewer assets under management (AUM) than equity ETFs, which most recently had a global invested volume of USD 6.1 trillion, there have been high inflows into bond ETFs in recent years. In 2019, these inflows were almost on a par with those in equity ETFs (Figure 1, right). In addition to the attributes of simplicity and transparency, the high inflow of funds into bond ETFs can probably also be explained by the eroding yields in the area of fixed-income securities and the associated increased cost sensitivity on the part of investors. While the growth in the importance of passive bond products is a reflection of their growing popularity, it also poses an increasing regulatory challenge in terms of the functioning of the underlying market (Rhodes and Mason 2019).
In view of the dynamic market development and the growing importance of passive bond strategies, this paper examines the extent to which active bond fund managers can beat passively investing bond ETFs or a corresponding benchmark. The particular relevance of this question in the bond sector and the motivation for the study derived from this will be clarified by first discussing the main characteristics of bonds or the bond market. These special characteristics mean both additional opportunities and additional challenges for active portfolio management.
The majority of empirical findings with regard to the equity market speak against a sustainable outperformance of active managers. Although the probability of success of active fund management depends strongly on the market under consideration and the underlying study periods, most corresponding studies come to the conclusion that the majority of active equity funds do not manage to beat the broad market, especially over the long term (e.g. Chan and Lazzara 2018). This is not surprising, since the sum of the performance of all investors corresponds to the market return. If one also takes into account the costs of active management, the average of active managers must logically lag behind the market. However, this regularly focuses only on returns, while the lower volatility of active approaches is rarely addressed.
With this study, we want to make a further contribution to the "active vs. passive" debate by focusing on the bond market and re-examining our findings from previous analyses.1 We show that active bond fund managers with a globally oriented, flexible investment approach can certainly beat the broad market over longer periods of time. Unsurprisingly, however, this result does not hold for the entire sample of funds analysed and over all investment periods. Similar to ETFs in the equity space, the superiority of actively managed funds requires finding capable managers who follow a consistent investment strategy.2
In the following, we first discuss the special characteristics of bonds or the bond market, focusing on features that distinguish it from the stock market. In section 3 we describe our methodology and data. Section 4 shows and comments on the main results. The last section concludes our analysis.
In terms of market volume, the bond market is the most important capital market segment for raising funds for companies and governments. The fixed-income instruments issued there are characterised by a variety of special features that make analysing and investing a challenge. However, the increased effort in assessing opportunities and risks when investing in bonds goes hand in hand with an increased potential for a sustainable outperformance of active bond strategies compared to the overall market. If active managers can act free of a benchmark, rating, and currency restrictions, this should promote the corresponding potential for outperformance. The prerequisite for this, however, is that a consistent investment strategy is pursued, understood and consistently implemented.
In the following, we discuss the most important features and resulting opportunities and risks (Table 1).
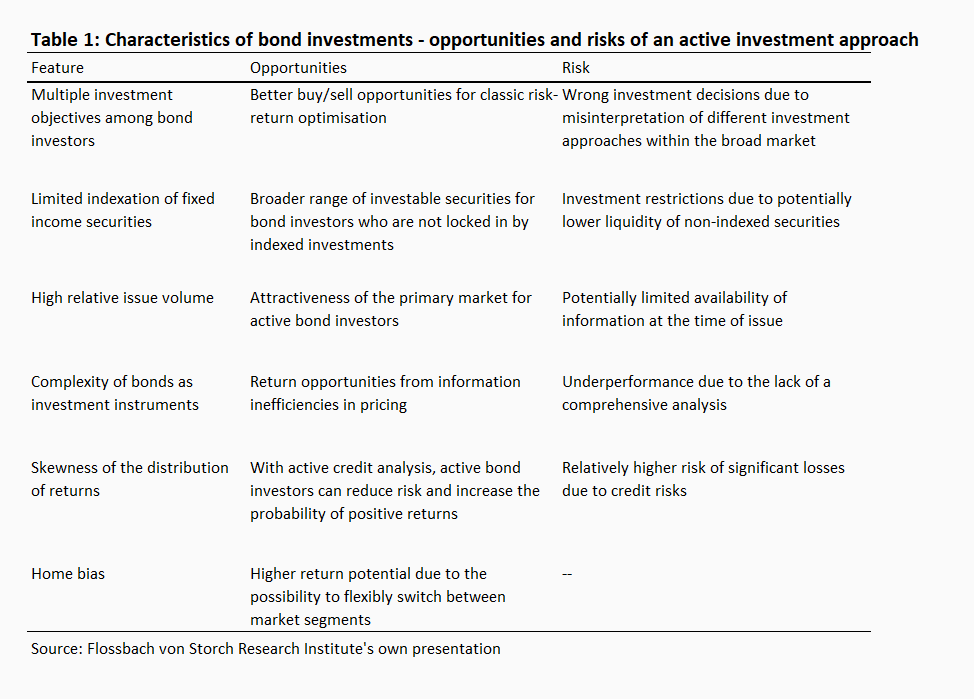
While equity investors usually pursue the goal of optimising their net return, bond investors often define investment goals that go beyond pure return maximisation and may even be associated with losses due to certain restrictions in the underlying investment approach. These include in particular central banks, which act as buyers of government and corporate bonds to achieve their monetary policy goals, as well as insurance companies, which have to optimise their asset-liability structure in addition to the goal of maximising returns. For bond investors with a flexible investment approach, whose primary goal is to optimise net returns, this circumstance creates the opportunity to take advantage of attractive investment opportunities that result in higher returns. However, difficulties of interpretation in the analysis of the diverse investment objectives within the broad bond investor universe lead to an increased complexity of the bond market.
Only a small proportion of outstanding fixed income securities are integrated into market indices and thus tracked by passive strategies. This is because traditional indices normally only include bonds with a credit rating, and often only investment grade bonds are included, as is the case with the Bloomberg Barclays Global Aggregate (BBGA) Index. However, not every bond has a rating. Moreover, ratings are often adjusted with a delay to reflect evolving economic conditions. For active bond fund managers who are not bound by credit rating requirements, this results in a much broader universe of investable securities. The flexibility also makes it possible to react more quickly to changes in quality as well as to cyclical changes in economic conditions. However, securities that are not included in indices are usually less liquid, which is why the investor is regularly confronted with bid/ask spreads here.
The rise of passive index funds in recent years is explained, among other things, by the simplicity of the products. However, the indices to be tracked are often structured in a far more complex way than is the case with stock indices. The BBGA index, for example, contains over 25,000 securities that have to be replaced regularly. This is because the issue volume of bonds in relation to the market value of the outstanding securities is far higher than that of equities. Conventional bond indices, however, include issued bonds only with a delay, so that an active presence on the primary market can be worthwhile for the active manager. For example, new issues are usually not included in the relevant indices until the end of the month, which precludes the passive investor from earning new issue premiums. At the same time, in the absence of market prices, investing in bonds via the primary market requires a high level of expertise in evaluating the relevant information in order to be able to measure the attractiveness of the issue pricing, which is an additional cost factor for active investments.
Bonds can be structured in an extremely complex way. Coupon and redemption structures, currency and inflation risks, embedded derivatives as well as regulatory and tax peculiarities are only a selection of characteristics that can make efficient pricing a challenge. Accordingly, pricing in the bond market is on average less efficient than is the case for equities. The limited information efficiency offers opportunities for active bond investors. However, the prerequisite for this is the correct assessment of the attractiveness of the bond, which requires corresponding expertise. If this is lacking, the opportunity becomes a risk.
Moreover, the yield distribution of bonds does not follow the law of large numbers and the yield development in the short term does not follow a random walk. Thus, a high probability of weak positive returns contrasts with a low probability of high losses resulting from the risk that the debtor does not properly meet its payment obligations or defaults altogether. However, this risk can be reduced through active credit risk analysis. Basically, it is important to bear in mind that unlike many stock indices, it is not the companies whose market capitalisation has increased due to above-average economic development that are highly weighted, but rather those securities where the issuer has above-average debt.
Finally, it should be noted that investors are often subject to a home bias when selecting their investments. Thus, investors disproportionately invest in their home market. Investors relying on a globally investing bond fund manager who, unlike an index, can switch between markets without restrictions, receive significant additional return opportunities.
The preceding considerations suggest that existing investment opportunities in the bond market exhibit price inefficiencies more often than is the case in the equity market. However, this does not necessarily mean that the flexibility of a global bond fund manager must favour sustainable excess returns. For example, the inherent market complexity increases the challenges of analysis, which may be disadvantageous to some managers. It is likely that the range of possible development paths will widen, which will be expressed in the form of a high range of returns. However, similar to equity funds, some bond funds are only actively administered, but not necessarily actively managed, which can lead to only a slight deviation in portfolio allocation and returns from the benchmark.
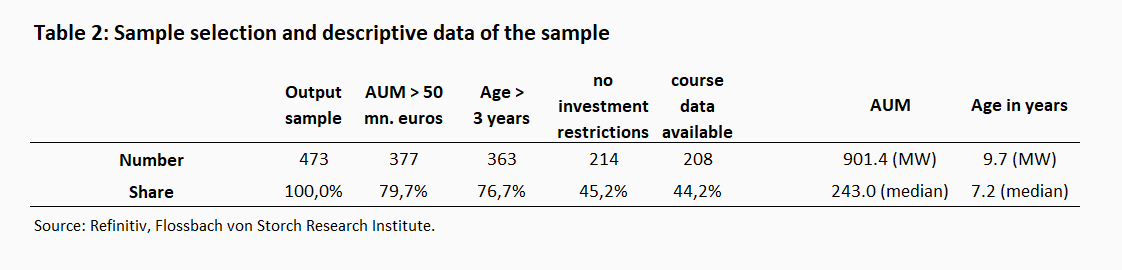
Initially, 473 bond funds were included in the study, which, according to the fund analysis company Morningstar, are largely free of restrictions in the selection of securities. Only funds with at least €50 million in assets under management (AUM) and a price history of at least three years as of 31 December 2020 were included in the final sample. The remaining funds were then examined for any investment restrictions on the basis of the published product information. In addition to funds that aim for a rigid allocation to certain issuers (government vs. corporate bonds), funds that explicitly follow a benchmark were also excluded. Limitations in data availability reduced the sample by a further six observations, so that in the end 208 funds were included in the analysis. Table 2 provides an overview of the adjustment steps that were carried out. For these funds, the main share class was taken into account in each case. When comparing the performance, the total return in euros was used, so that the use of income (accumulating vs. distributing funds) has no influence on the result. The period under review extends over the years 2010 to 2020 and thus covers an entire economic cycle.
The average fund size of the 208 analysed funds is 901.4 million euros, although some very large funds distort the picture, as the much smaller median of 243.0 million euros shows. On average, the funds have a price history of 9.7 years (median: 7.2 years).
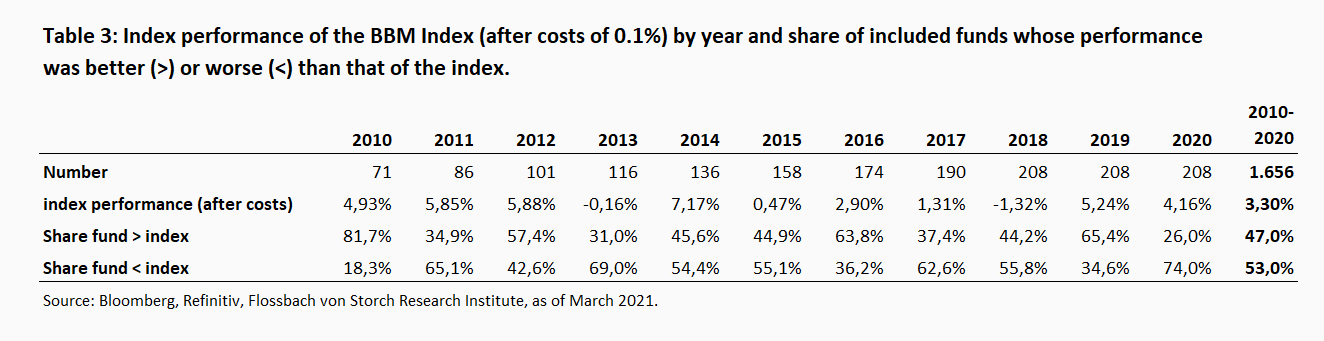
Since the focus of the analysis is on the performance differences of active investment approaches compared to passive ones, it is important to choose an appropriate benchmark for the active managers. The most popular fixed income index worldwide is the Bloomberg Barclays Global Aggregate Bond Index (BBGA). However, this only includes investment grade bonds, which is why it is not fully suitable for the intended comparison. Therefore, the Bloomberg Barclays Multiverse Total Return Index is used, which includes both investment grade and non-investment grade bonds. Since no passive instrument with a sufficiently long price history could be identified that tracks this index, the development of a hypothetical index-tracking product was simulated. For this purpose, an annual expense ratio of 0.1% was deducted from the performance of the BBM index. This expense ratio is in the lower range of the expense ratios of the identified passive index products.
Figure 2 compares the performance of the active funds based on the mean and median of the Bloomberg Barclays Multiverse Index. The differences in performance are quite small, both on a mean and median basis. The active funds have an average annualised return of 3.46% (median 3.09%). In contrast, the BBM Index has an annualised return of 3.30%. Figure 3 shows the respective returns separately by observation year. The figure shows that the years 2010, 2012, 2016 and 2019 were comparatively successful years for the active managers, while they lagged significantly behind the constructed index, especially in 2011, 2013 and 2020.
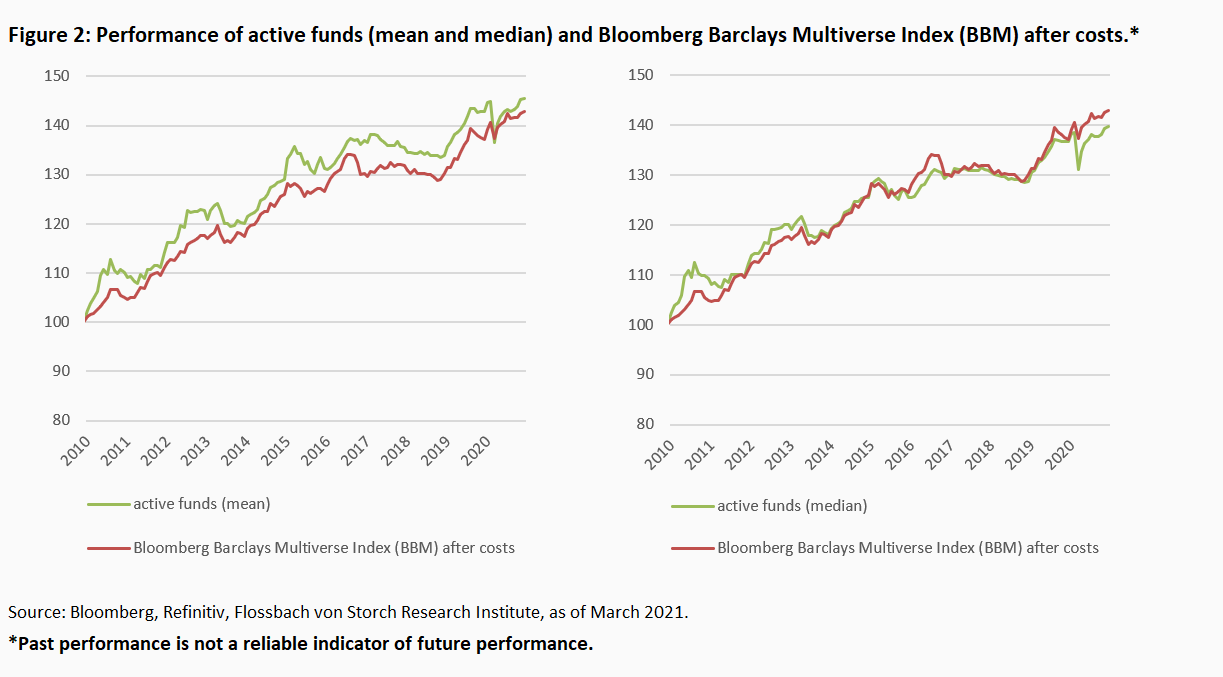
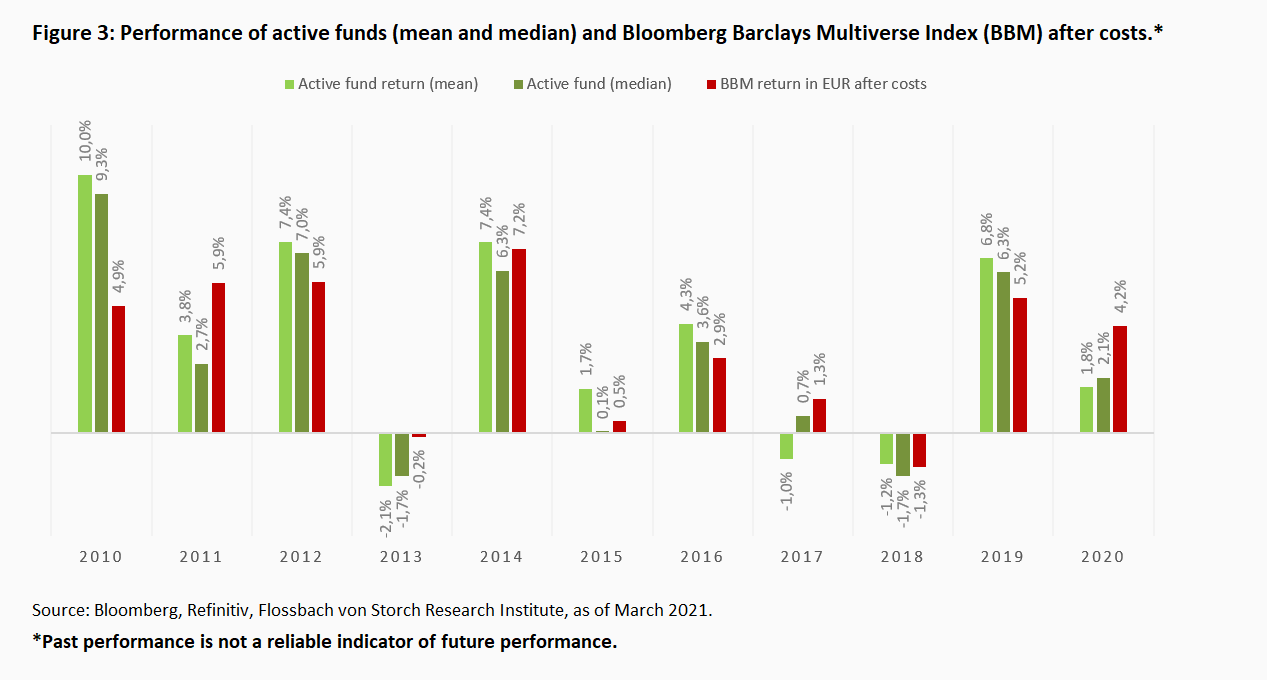
Table 3 lists the proportion of funds that were able to beat the benchmark index in the individual years, regardless of the extent of the excess return achieved. As Figures 1 and 2 already suggested, the picture is quite balanced. The proportion of funds that outperformed the index is slightly below average at 47.0%. Especially in 2011, 2013 and 2020, the share of "successful" funds is low at 34.9%, 31.0% and 26.0% respectively. In 2010, in particular, the active fund managers were able to outperform with a rate of 81.7 %.
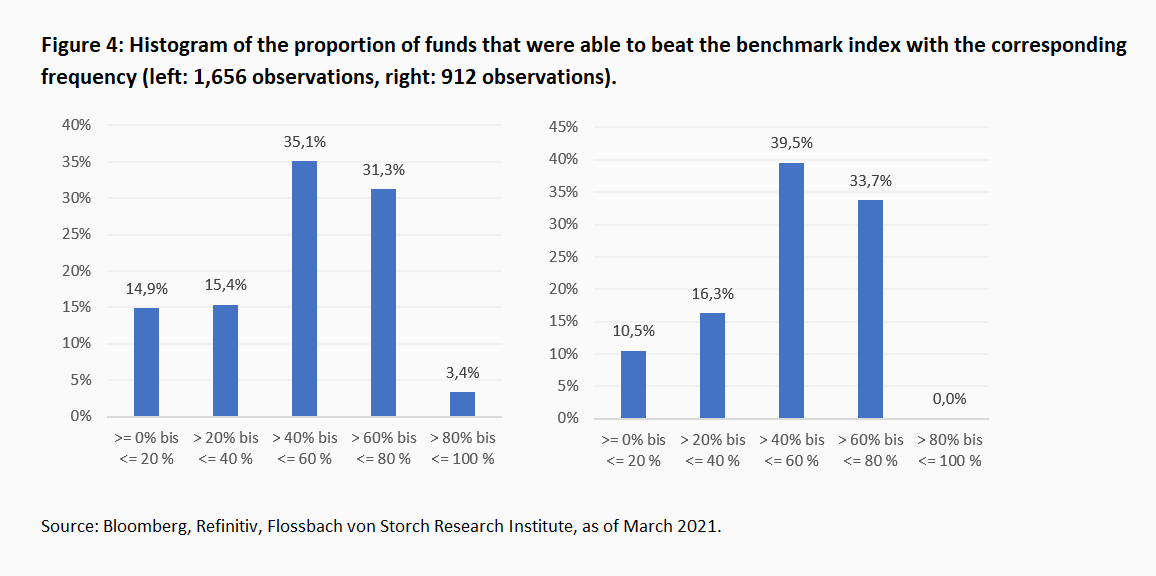
However, Table 2 does not provide information on the extent to which individual funds were above or below the BBM Index (after costs) over longer periods of time or on a regular basis. Figure 4 shows the relative frequencies of the "success rates" achieved. The relative frequency of 31.3% in Figure 4 (left) indicates that just under a third of the funds showed a performance that was above that of the index in 60% to 80% of the years examined. Overall, the picture is relatively symmetrical, with the group of funds that outperformed the benchmark in more than 60% of the years considered slightly larger than the group of funds that did so in less than 40% of the years (31.3% versus 30.3%). It is noticeable, however, that the rate of very successful funds, at 3.4%, is significantly lower than the group of funds showing a very low success rate (14.9%).
However, the significance of this result is limited because all funds were included here, i.e. also those that only show a price history in three of the eleven years considered. In order to obtain a more reliable picture, in a next step only those funds were considered that have existed for at least ten years (Figure 3, right). This step reduces the sample to 84 or 912 observations. Here the previous result is confirmed, according to which the group of funds that frequently manage to beat the index is slightly larger than the group that frequently fails to do so (33.7% vs. 26.8%). Consistent with the previous result, more than one in ten funds (10.5%) fail to beat the benchmark in more than one in five years (<= 20%), while no fund managed to beat the constructed index in more than 80% of the years studied. The value contribution of the extremely weak funds explains why, on the basis of the median, the funds lag behind the benchmark index overall. In contrast, the histogram shows that some managers were very well able to beat the benchmark over longer periods of time or in many of the years considered. In summary, the strong results of one third of the managers (33.7%) are slightly outweighed by the very weak results of less than one third of the managers (26.8%).
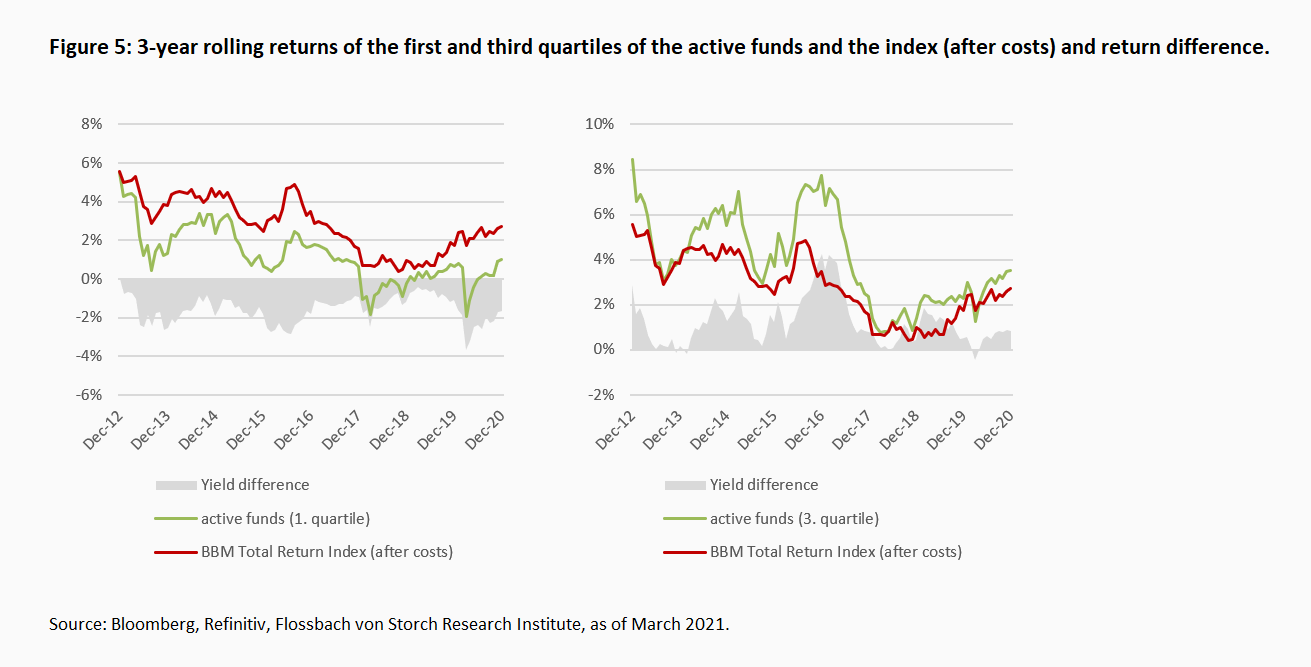
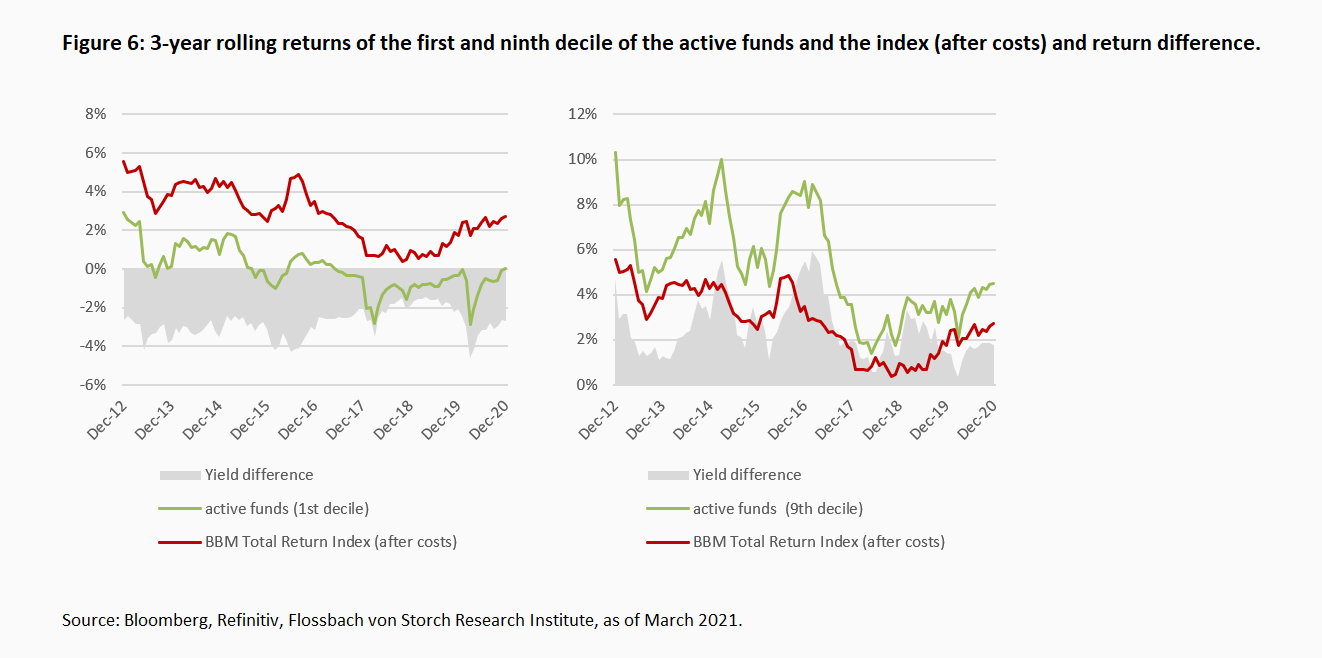
The previous discussion suggests that a consistent investment strategy is required to construct a portfolio with an attractive risk/reward ratio that offers enough flexibility to generate above-average returns even during temporary market turbulence. Figures 5 and 6 show the rolling 3-year returns of the weakest and best quartile and decile of the funds included. Here, too, the symmetry described above is evident, according to which the weaker funds lag behind the index in roughly the same dimension in which the better funds beat the index.
The results show that the question of how to identify a promising fund is of great importance to investors. If one assumes that past success is not based on chance but is the result of a consistent investment strategy, then past performance is the only reliable criterion for separating the wheat from the chaff. Investors should therefore familiarise themselves intensively with the respective investment objectives, the investment strategy derived from them and the performance achieved in the past.
The bond market is very complex due to different characteristics of the underlying instruments, its market mechanisms and the objectives pursued by market participants. This can foster inefficiencies in the pricing process. For managers of flexible bond funds, this results in a variety of different sources of return. However, the complexity of the bond market also leads to challenges. As our analysis shows, the average of the funds studied achieves roughly the same return as the broad market over the study period 2010 to 2020. While some active fund managers managed to beat the BBM Total Return Index used as an approximation for the performance of passive products over longer investment periods, other funds lagged behind the market. Overall, the success rate of active managers in the area of bond funds is higher than for equity funds. As is the case for equity funds, it is also true in the bond sector that one should not blindly rely on the superiority of active fund solutions. The search for capable managers with a consistent investment strategy is a necessary prerequisite.
Ben-David, I. Franzoni, F. A. , & Moussawi, R. (2017). Do ETFs increase volatility? Journal of Finance, forthcoming.
Chan, F.M. & Lazzara, C.J. (2018). Degrees of Difficulty: Indications of Active Success, S&P Dow Jones Indices.
Da, Z., & Shive, S. (2018). Exchange traded funds and asset return correlations. European Financial Management, 24(1), 136-168.
Easley, D., Michayluk, D., O'Hara, M., & Putniņš, T. J. (2020). The active world of passive investing. Mimeo.
Hamm, S. J. W. (2014). The effect of ETFs on stock liquidity. Working Paper.
Hougan, M. (2016). What active ETFs say about the future of active management. Journal of Financial Planning, 29(9), 30.
Israeli, D., MC Lee, C., & Sridharan, S. A. (2017). Is there a dark side to exchange traded funds? An information perspective. Review of Accounting Studies, 22(3), 1048-1083.
Kula, G., Raab, M., & Stahn, S. (2017). Beyond smart beta: Index investment strategies for active portfolio management. John Wiley & Sons: UK.
Krause, T., Ehsani, S., & Lien, D. (2014). Exchange-traded funds, liquidity and volatility. Applied Financial Economics, 24(24), 1617-1630.
Rhodes, M. E., & Mason, J. R. (2019). Hinder or help? ETF corporate bond ownership and market quality. Working Paper, University of North Texas and Louisiana State University.
Stankevičienė, J., & Petronienė, I. (2019). Bond mutual funds vs. bond exchange traded funds: Evaluation of risk adjusted performance. Administrative Science, 9(31): 1-14.
1 Gehringer, A./Lehmann, K. (2018) "Active vs. passive: What really matters with bonds", Flossbach von Storch Research Institute, Society and Finance, 27/12/2018.
2 Gehringer, A./Lehmann, K. (2017) "Beyond chance", Flossbach von Storch Research Institute, Market Behaviour 21/9/2017.


Legal notice
The information contained and opinions expressed in this document reflect the views of the author at the time of publication and are subject to change without prior notice. Forward-looking statements reflect the judgement and future expectations of the author. The opinions and expectations found in this document may differ from estimations found in other documents of Flossbach von Storch SE. The above information is provided for informational purposes only and without any obligation, whether contractual or otherwise. This document does not constitute an offer to sell, purchase or subscribe to securities or other assets. The information and estimates contained herein do not constitute investment advice or any other form of recommendation. All information has been compiled with care. However, no guarantee is given as to the accuracy and completeness of information and no liability is accepted. Past performance is not a reliable indicator of future performance. All authorial rights and other rights, titles and claims (including copyrights, brands, patents, intellectual property rights and other rights) to, for and from all the information in this publication are subject, without restriction, to the applicable provisions and property rights of the registered owners. You do not acquire any rights to the contents. Copyright for contents created and published by Flossbach von Storch SE remains solely with Flossbach von Storch SE. Such content may not be reproduced or used in full or in part without the written approval of Flossbach von Storch SE.
Reprinting or making the content publicly available – in particular by including it in third-party websites – together with reproduction on data storage devices of any kind requires the prior written consent of Flossbach von Storch SE.
© 2024 Flossbach von Storch. All rights reserved.

Agnieszka Gehringer
Senior Research Analyst
Agnieszka Gehringer joined the institute in 2015. She studied economics at the University of Rome “La Sapienza” and later earned a PhD in economics of complexity at the University of Turin. Since November 2019 she has been a professor of Economics at the Cologne University of Applied Sciences and since July 2016 a lecturer at the University of Göttingen. She has published several articles in academic journals and is an advisor to the EU.
All articles by Agnieszka Gehringer