20.11.2023 - Studies

The term "turning point" is rather overused. However, it is striking how well the term fits these days not only to epochal upheavals in global politics and the economy, but also to what is happening in rather small-scale, comparatively unimportant areas - the stock market, for example.
Apple presented its annual results this November. Nothing special in itself. However, the details of the report on the financial year, which ends on 30 September for the Californian company, clearly show for the first time a turnaround that central banks around the world have initiated over the past two years: the turnaround in interest rates.
In the past financial year, the Group, which most recently traded at around USD 2,900 billion on the stock exchange, not only had to pay 34 per cent more in interest than in the same period of the previous year. These expenses are increasingly standing out from the income from interest and dividend investments, which first became apparent in the 2022 financial year and has now solidified (chart 1).
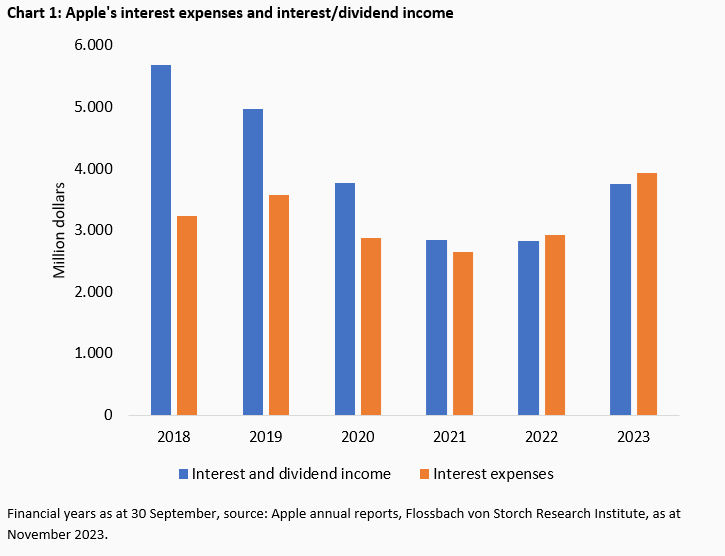
The times in which the world's most valuable company earned a handsome extra income from the difference between interest/dividend income and expenses alone are therefore over. As recently as 2018, the bottom line was just under 2.5 billion dollars - some DAX members don't even earn that much from their operating businesses.
Even a financially strong company like Apple is therefore negatively affected by the general turnaround in interest rates. This suggests that the rise in interest rates is also slowly but surely eating into the profit and loss accounts of companies across the board. And that this is increasingly taking place "in the red".
In the spring, the findings were still clear: the revenue side was the main beneficiary. The treasurers in the companies reacted quickly to the higher interest rate levels and cashed in handsomely - while the more sluggish, because more long-term, financing hardly took advantage of the increase.1
The question therefore arises as to when this could happen and to what extent - and what impact this will have on the earnings situation and therefore also on the valuation of shares.
The USA sets the pace on the stock market. American stocks represent 46 per cent of the global market capitalisation of around 103 trillion dollars. The S&P 500 alone is worth 39 trillion dollars. The index is therefore suitable as a representative analysis.
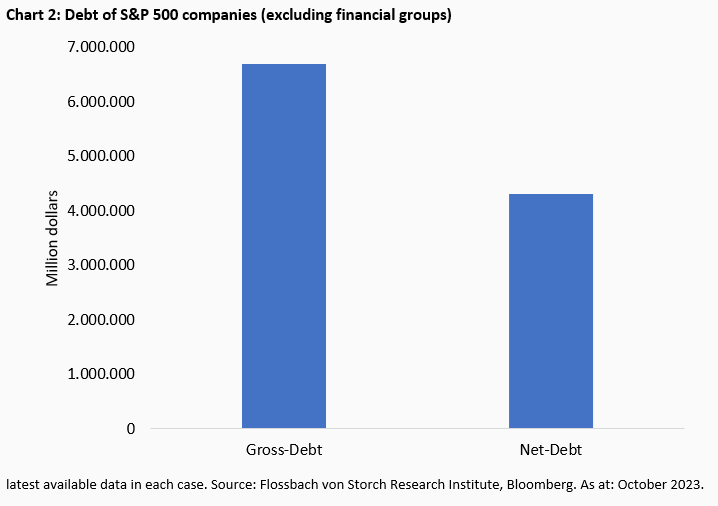
This excludes financial groups whose financing structure differs from that of traditional industrial, pharmaceutical or technology companies. If you isolate these financial sector companies from the S&P 500, you are left with 431 companies to choose from. These companies recently reported gross debt of a good USD 6,690 billion and net debt of a good USD 4,313 billion (chart 2).
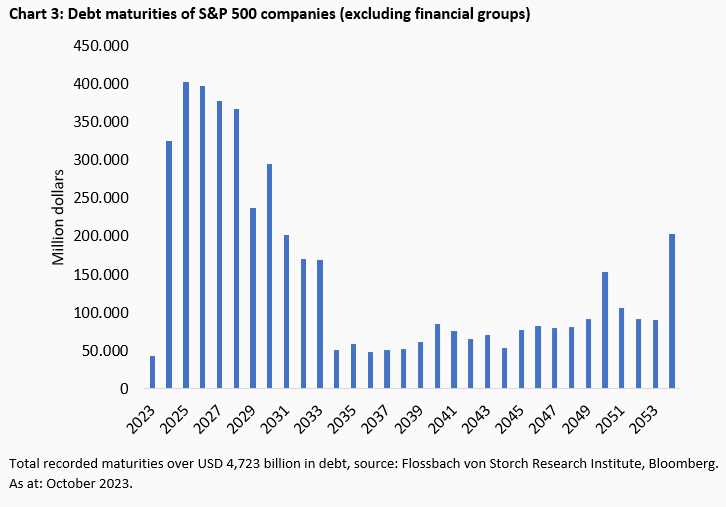
These S&P 500 companies have a good USD 2,400 billion in debt maturing between 2024 and 2030 inclusive. That is 36 per cent of all debt and 51 per cent of all debt with maturities (chart 3).2
By way of comparison: In the European Stoxx600 excluding financial groups, 69 per cent of all debt due for potential refinancing will fall due between 2024 and 2030, totalling just under EUR 1,200 billion (chart 4).
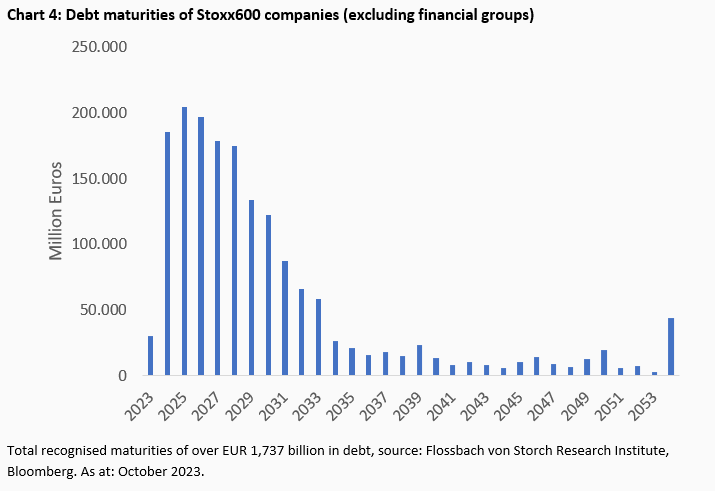
European companies have significantly less long-term financing than their US counterparts. The turnaround in interest rates should therefore have a faster overall impact here.
However, how expensive it will be for an individual company or for all the groups in an index depends on several factors for which a forecast is subject to great uncertainty.
In general, of course, the general current and future interest rate level plays a role for everyone. The level of previous interest rates must also be taken into account. In the case of a once long-dated bond that is now maturing soon, the new coupon does not necessarily have to be higher than 12 or 15 years ago. In this case, the previous interest burden would not change for the time being.
In addition to the company's individual debt maturities, there is also the extension period and the company's current and future credit rating.
Investor expectations also play a role: Anyone who fears even higher interest rates in the foreseeable future may be more hesitant about a new bond priced close to the current interest rate level. Yield premiums above the levels traded on the secondary market (i.e. the stock exchange or other trading centres) are regularly observed for new issues anyway.
As far as credit ratings are concerned, the trend is clear: ratings have been falling for decades. According to a study by rating agency Moody's, an average of around 15 per cent of Aaa-rated corporate bonds have been downgraded every year since 1920. According to the data provider Bloomberg, less than one per cent of the credit universe it covers worldwide is still rated AAA. Eighteen years ago, for example, the chart was considerably higher at 7.4 per cent.
Only two companies still represent the crème de la crème in the US corporate sector: Microsoft and Johnson & Johnson are the only two index companies from the S&P 500 that still have the top AAA rating.
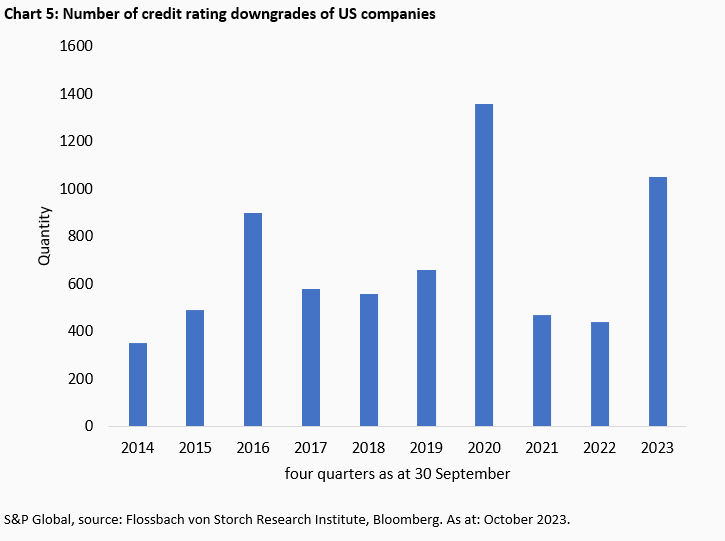
And the short-term trend also confirms the trend of the century. Most recently, in October, the three major rating agencies S&P Global, Moody's and Fitch downgraded twice as many US companies as they upgraded.
In 2023, for example, S&P Global downgraded the rating of US companies 812 times in the first three quarters of the year, improving their credit rating in only 489 cases. The so-called upgrade/downgrade ratio thus fell to 0.6 - since 2013, it has only been lower in the coronavirus year 2020 and briefly in 2015. Measured by the downgrades in the past four quarters, S&P Global has given US companies a weaker credit rating 1052 times. In the past ten years, the number has only been higher once, also in 2020 (chart 5).
S&P Global itself expects that a prolonged period of high interest rates could become a "major challenge". The abundant credit volume maturing in 2025 could "exclude" the weakest borrowers from refinancing. According to the rating agency, most issuers would then be "confronted with higher ongoing debt servicing costs".
This could be exacerbated if inflation were to slow and the level of real interest rates (market interest rates minus inflation) were to rise. In conjunction with potentially lower economic growth, lenders would generally become "even more selective" or demand "higher compensation for the increased risk".
According to S&P Global, this could contribute to default rates for speculative loans (junk), for example, rising above the pessimistic forecast of 6.5 per cent in the USA and 5.5 per cent in Europe over the next twelve months.
Of course, defaults cannot be ruled out for the companies in the S&P 500, even if the groups have the comparatively best chances of raising capital or refinancing maturing debt precisely because they are listed on the stock exchange.
If you take an intersection of the S&P 500 companies (excluding financial groups) with fairly high debt (over ten billion dollars) and those with fairly weak interest coverage, you sort 82 of the 431 industrial companies into the bucket (table 1).
The interest cover, the ratio of earnings before interest and taxes (EBIT) to interest expenses, is less than five for the selection based on the last four quarters as at 30 June. In some cases, it is negative because losses have already been incurred before taxes and interest.
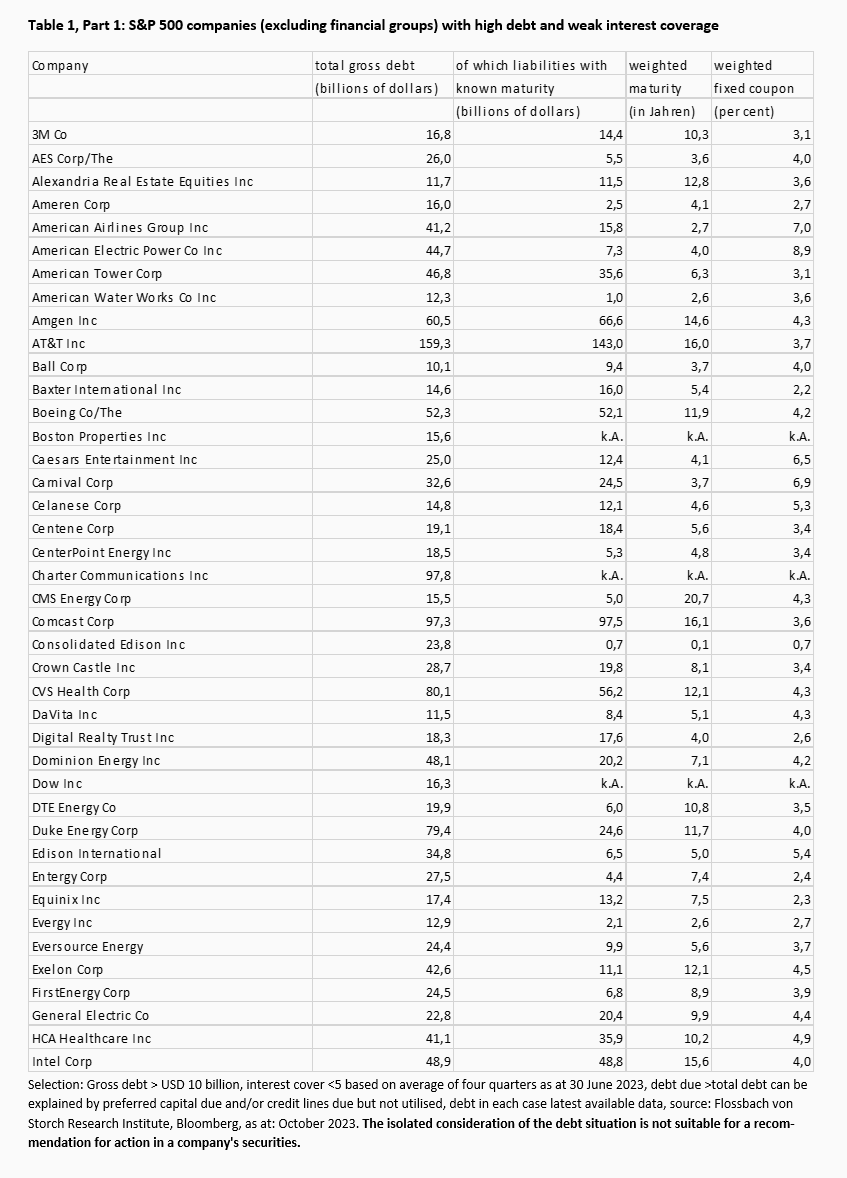
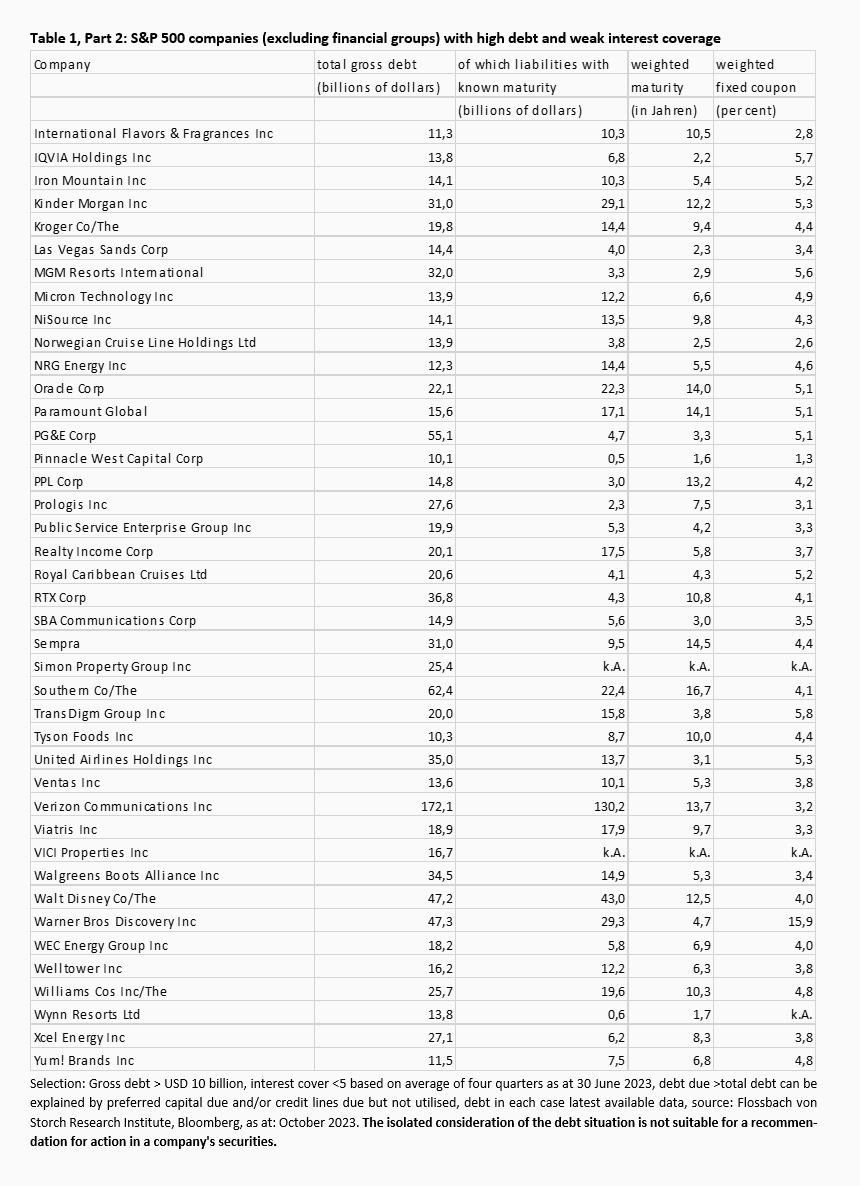
Under constant circumstances, five (or fewer) annual interest expenses eat up one annual profit (measured in terms of EBIT). In some cases, this may be due to a short-term, temporary negative operating profit trend. However, this group is also likely to include some so-called zombie companies whose survival could only be ensured with an injection of external capital or in the event of a surprising downward turn in interest rates.
In any case, the 82 corporations alone reported gross debt of USD 2.56 trillion (USD 30.9 billion on average), a good 38 per cent of all debt of the 431 S&P companies excluding financial groups. Maturities can be determined for 1.44 trillion dollars of this. Here too (as in the overall index excluding financial groups), the weighted average maturity of 7.7 years provides a fairly comfortable time cushion.
However, with an average weighted coupon of 4.3 per cent, the 82 companies are already transferring more to their creditors than the majority of S&P 500 companies, which is only logical given the weak interest cover.
For all S&P 500 companies excluding financial groups, the interest burden recently averaged a good 3.7 per cent - 0.6 percentage points above the historic low of the second quarter of 2022 (chart 6).
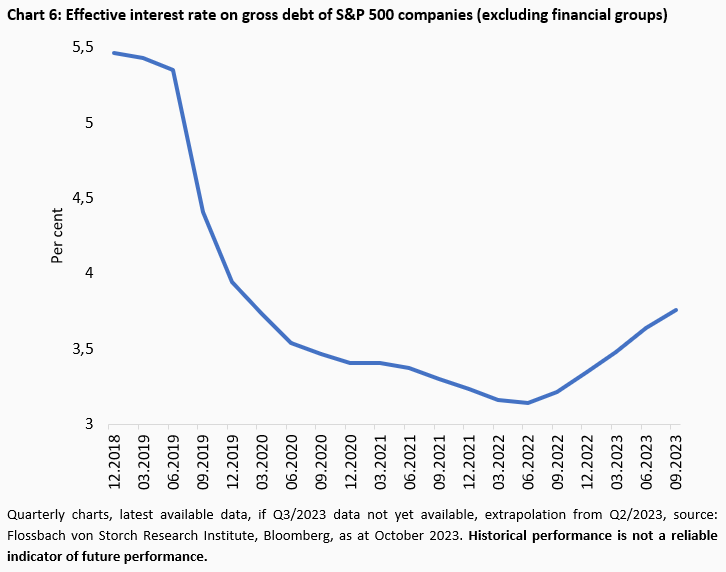
Since the cyclical low in 2022, interest expenditure has risen only slightly on a quarterly basis, by just under USD 11.4 billion or just under 27 per cent. In view of the still manageable refinancing requirements, there has therefore been no major turnaround. In contrast, interest income has almost quadrupled from the low - the increase of a good USD 10.2 billion almost covers the rise in interest expenditure (chart 7).
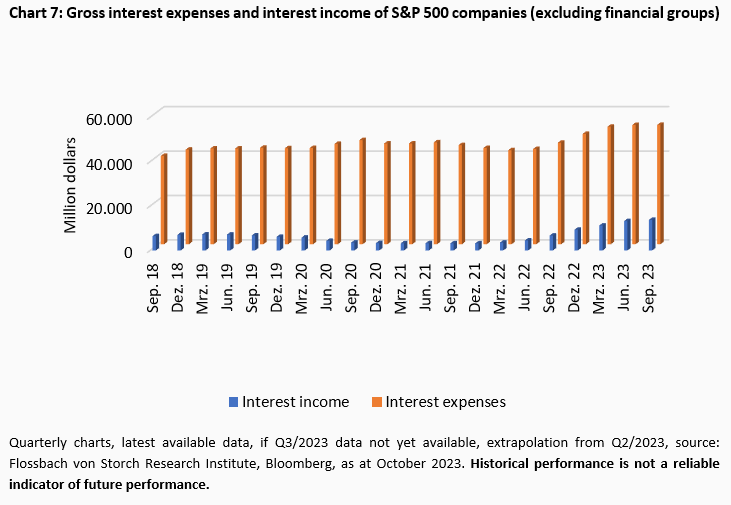
Overall, the income statements have therefore hardly deteriorated over this shorter period from an interest perspective alone. However, an upward trend in interest expenditure is also slowly becoming apparent.
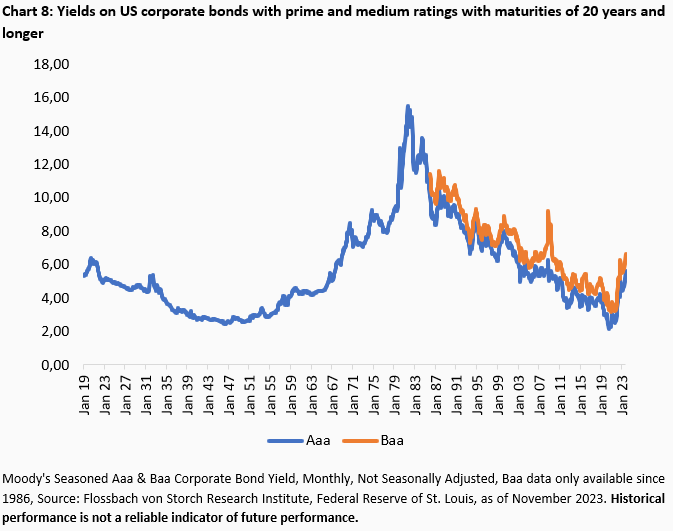
By contrast, market interest rates have risen much more significantly - to levels last demanded by investors during the financial crisis. For companies with a mediocre credit rating, yields are a good 6.6 per cent on average for maturities of 20 years or more, a good double the low at the end of 2020. This means they are currently only around 0.6 percentage points higher than a one- or even ten-year interest rate.
For AAA/Aaa borrowers, market interest rates have even risen by a good 160 per cent to 5.6 per cent most recently.
In a long-term comparison, it is easy to recognise the end of the roughly 40-year bull market on the credit market with steadily falling interest rates. After the end of the penultimate, overarching bull market, interest rates then rose for around 36 years (chart 8).
The recent sharp rises always immediately translate into cash to be paid by companies when they refinance debt with lower coupons than the current market interest rate. It is clear that new loans are in any case more expensive than they have been for around 14 years.
But what are the effects?
From 1991 to 2022, EBIT in the S&P 500 (overall index) increased by an average of 5.2 per cent annually. We also assume this for the future, in this case for the S&P 500 excluding financial groups.
We also assume three different scenarios: Firstly, the interest rates to be paid by companies increase by one percentage point from the last level (3.7 per cent), secondly by two percentage points and thirdly by three percentage points.
The latter scenario would therefore reflect the current interest rate level for long-term corporate loans with a medium credit rating. The other two scenarios assume a mild to stronger decline in current market interest rates over the coming years.
As a rough guide: assuming a constant premium for corporate loans on government bonds, this would mean unchanged risk-free US yields for 20-year maturities of around 4.7 per cent at the time of the survey. In the other two cases, the average yield level for US Treasuries would fall to 3.7 and 2.7 per cent.
In the combinations mentioned, this is not a pessimistic scenario in any of the cases; on the contrary, it is rather favourable to favourable. In addition, we initially assume that there is no new borrowing; companies are merely refinancing maturing debt.
The effect: an assumed increase in EBIT to USD 2,165 billion by 2030 would leave USD 1,813 billion (one percentage point higher interest than the previous 3.7 per cent), USD 1,791 billion (plus two percentage points) or USD 1,770 billion (plus three percentage points) in earnings before taxes (EBT) (chart 9).
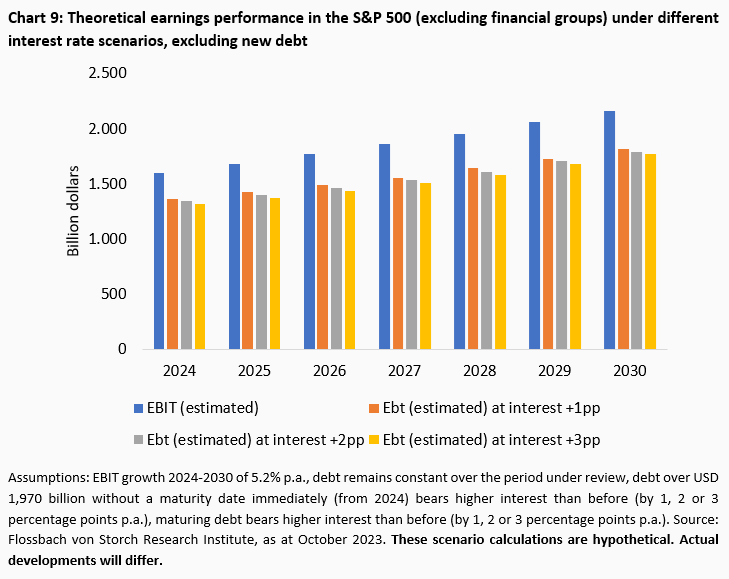
EBIT would grow cumulatively by 35.5 per cent in the years 2024 to 2030, while pre-tax profits would increase by almost the same rate of 32.9/33.6/34.3 per cent.
In the worst-case scenario, the S&P 500 companies (excluding financial groups) would have to pay a total of USD 43 billion more in interest expenses than in the best-case scenario - that would be two per cent of assumed EBIT in 2030.
In a second projection, we assume that companies will maintain the pace of new debt they have incurred over the past ten years. Debt growth has been 8.3 per cent per year. Accordingly, gross debt would rise from 6,690 billion dollars to 11,690 billion dollars in 2030.
The effect: an assumed increase in EBIT to USD 2,165 billion by 2030 would leave USD 1,556 billion (one percentage point higher interest), USD 1,506 billion (plus two percentage points) or USD 1,456 billion (plus three percentage points) in pre-tax earnings (chart 10).
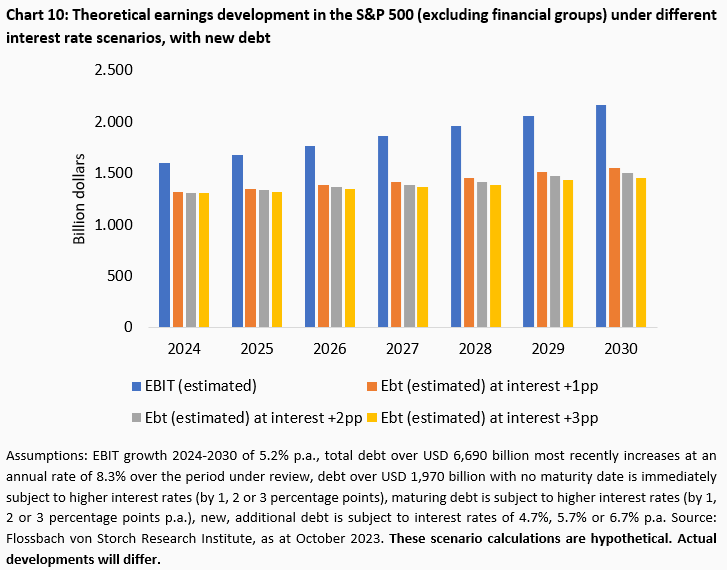
In the years 2024 to 2030, EBIT would grow cumulatively by 35.5 per cent, while pre-tax profits would fall significantly by only 18.4/15.1/11.7 per cent due to the significantly higher interest payments.
A comparison of the worst case scenario here with the best case scenario from the first extrapolation without new borrowing reveals a difference in the two pre-tax profits of USD 357 billion. This would correspond to a pre-tax profit for the index excluding financial groups that is almost 20 per cent lower than in the assumed best case.
As I said, these theoretical assumptions are not forecasts, but they do give an indication of future developments. And on the stock market, investors have evidently been anticipating the adversity that threatens more highly indebted companies with weak interest cover for some time.
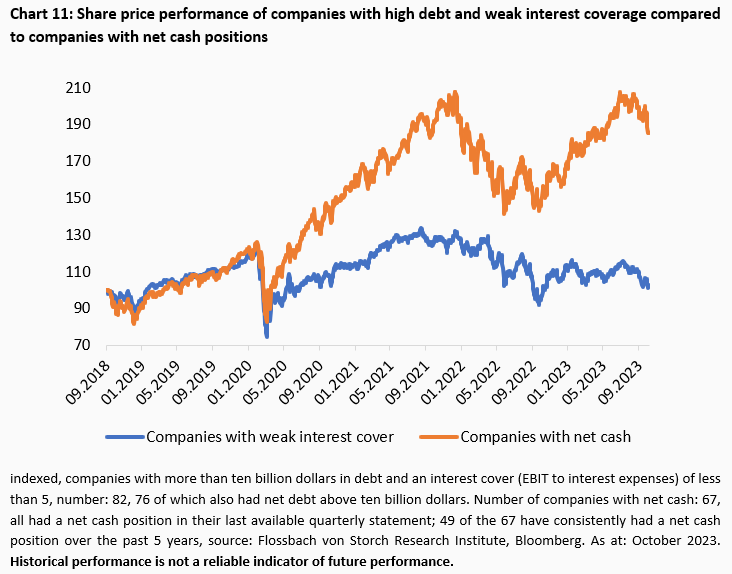
Since the coronavirus low in spring 2020, companies that regularly have a net cash position have performed significantly better than the debt groups. Over a five-year period, the latter now show virtually no share price growth, while the "rich" group is 85 per cent ahead on average (chart 11).
Assuming rising operating profits and, from today's level, at most constant to falling yield levels, there would only be a minor braking effect on share prices ceteris paribus - assuming that the companies in the S&P 500 exercise debt discipline.
If this is not the case, then, under the given assumptions, profits and thus probably also cash inflows will be so weak on balance that the stock market as a whole will receive little tailwind from the earnings side in the coming years.
This would apply all the more if interest rates were to be higher than assumed on average over the period under review and/or operating profits were to develop more weakly than assumed.
It is worth mentioning that debt discipline could also have a braking effect: debt-financed share buybacks, which are an important price driver, would probably be lower. In addition, price-driving takeover activities would not be able to play a particularly large role. Instead, companies would have to focus their debt financing on productive investments in order to maintain the value of the company and take advantage of growth opportunities.
Anyone assuming that interest rates will not fall back to historic lows for some time is generally more likely to be in good hands with solidly financed companies with a balanced to positive cash/debt ratio
2 There is no maturity profile for almost 1,970 billion dollars. They are likely to be open-ended, but not necessarily non-cancellable.


Legal notice
The information contained and opinions expressed in this document reflect the views of the author at the time of publication and are subject to change without prior notice. Forward-looking statements reflect the judgement and future expectations of the author. The opinions and expectations found in this document may differ from estimations found in other documents of Flossbach von Storch AG. The above information is provided for informational purposes only and without any obligation, whether contractual or otherwise. This document does not constitute an offer to sell, purchase or subscribe to securities or other assets. The information and estimates contained herein do not constitute investment advice or any other form of recommendation. All information has been compiled with care. However, no guarantee is given as to the accuracy and completeness of information and no liability is accepted. Past performance is not a reliable indicator of future performance. All authorial rights and other rights, titles and claims (including copyrights, brands, patents, intellectual property rights and other rights) to, for and from all the information in this publication are subject, without restriction, to the applicable provisions and property rights of the registered owners. You do not acquire any rights to the contents. Copyright for contents created and published by Flossbach von Storch AG remains solely with Flossbach von Storch AG. Such content may not be reproduced or used in full or in part without the written approval of Flossbach von Storch AG.
Reprinting or making the content publicly available – in particular by including it in third-party websites – together with reproduction on data storage devices of any kind requires the prior written consent of Flossbach von Storch AG.
© 2024 Flossbach von Storch. All rights reserved.

Christof Schürmann
Senior Research Analyst
At the Institute since 2022. The graduate in business administration (FH), previously worked as a journalist and deputy head of "Money" at WirtschaftsWoche. The trained banker and book author ("Die Bilanztrickser") taught balance sheet research part-time at the private university BiTS in Iserlohn.
All articles by Christof Schürmann