31.01.2024 - Studies

9.3 per cent annual sales growth for almost a quarter of a century and an average annual profit increase of 12.5 per cent from 1998 to 2022: Lego would probably have been a company to Charlie Munger's liking if the Danes had ever been up for sale. Munger, who recently passed away at the age of 99, was Warren Buffett's brilliant partner for decades. Together they ran the investment holding Berkshire Hathaway until Munger's death on 28 November last year.
"We have really made our money with high-quality companies. In some cases, we bought the whole company. And in some cases, we only bought a large block of shares. But if you analyse what's happened, you've made the big money with the high-value companies. And most of the other people who made a lot of money did so in high-value companies," Munger told students at the University of Southern California Marshall School of Business in 1995.
It is simply best to focus on high-quality companies, summarised Munger.
Now the stock market -, in addition to a whole lot of short-term speculation - is essentially all about finding precisely that quality that Munger spoke of, and as represented by Lego, for example, with its strong growth over a long period of time, at least at first glance.
But the stock market would be a strange place if there were only black and white, only low or high quality. There are many different shades and, much to the chagrin of investors, they also change with the times.
It is therefore no easy task to identify drivers of returns for company share prices - not even in the rear-view mirror.
But even if the past is generally not a perfect guide to the future, a stock market retrospective could perhaps at least show characteristics that have characterised "good" and "bad" stocks. After all, real data and factors can be found here, whereas the future is uncertain.
There is no doubt that this can only be an attempt and not the ultimate definition of explanatory patterns. After all, the grail of the perfect stock selection can hardly be found even in retrospect, as there are too many influencing factors in the overall stock market cosmos, which is geared towards the future. And the past was once also the future, once unknown territory.
But the search for characteristics could be worthwhile, even if a retrospective view may seem a little cheap.
Different approaches can be found for an approximation, as there are a host of approaches or key figures. The development of interest rates and the interest rate policy of the central banks have a considerable influence on the stock markets. For the sake of simplicity, some people swear by so-called "technical analysis", which attempts to deduce the future from past price patterns.
It is not intended to go that far, and certainly not on the basis of price curves. Rather, the aim is to filter out the characteristics and differences of companies that have performed excellently on the stock market in the past and those that have performed very poorly on the contrary, from the perspective of a few selected, marketable key figures and their development.
The expectation is that this will not produce perfect results. And the fact that we are talking about correlations and not causalities is emphasised once again.
The European Stoxx600 and the American S&P 500 serve as a basis, from which the financial groups with specific characteristics that are not comparable with industrial or technology groups are initially removed.
This leaves 431 companies from the S&P 500. Of these, 419 have been listed for at least five years and 401 for at least ten years. In order to exclude distorting data from fast-growing or still loss-making and often less mature companies, those that reported sales of less than one billion dollars just over a decade ago were excluded, leaving 340.
In a first step, the 340 companies that outperformed the respective median over five and ten years were identified. The benchmark for this is the total return, i.e. the share price growth (or loss) plus reinvested dividends.
From this group, which were in the lead over both periods, the respective median was formed and, in a further step, those shares were identified which again beat this median in both periods. This was ultimately the case for 43 shares: they were awarded the accolade of "top companies" or tops.
The flop stocks can be identified in exactly the opposite way. Here, 28 companies and their securities underperform at all stages. The same method can be used to identify 20 top performers in the European Stoxx600 (excluding financial groups). A total of 81 companies underperformed here, again over both periods.
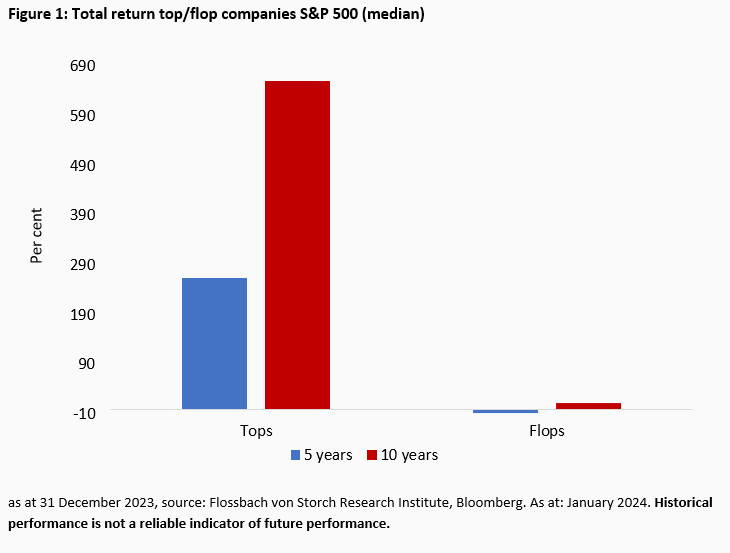
The top companies in the S&P 500 achieved a median total return of 660 per cent (average 1074 per cent) over a ten-year period as at 31 December 2023. Over five years, the median return was 265 per cent (average 331 per cent). Investors made a median gain of 13 per cent (average: 19 per cent) over ten years with the flops and a median loss of 8 per cent (average: 4 per cent) over five years (figure 1).
But what are the characteristics that distinguish the strong performers from the weak performers? Traditionally, sales and profit growth (here EBIT, earnings before interest and taxes) are suitable for measuring business development. The return on invested capital (ROIC) can be used to measure how much return a company gets from its capital. Cash conversion shows how well companies convert profits into cash.
And the ratio of net debt to EBITDA (earnings before interest, taxes and asset devaluations) and net debt to equity show the company's debt sustainability and capital strength. The period under review is ten years in each case.
The top companies in the S&P 500 recorded annual sales growth of 11.5 per cent (median, average 12.5 per cent). Revenue declined in 13 per cent of the 430 sales data analysed. All companies had positive growth over the ten-year period, with a good four-fifths growing by an average of more than eight per cent per year.
The weakest sales growth was reported by a major pharmaceutical manufacturer. It can be assumed here that the drug pipeline, which investors consider to be promising, could play a greater role than the current, rather weak revenue growth. This is speculation, assumes causality and is also a singular approach. However, the example shows that at the end of the day it always comes down to a detailed individual analysis.
In almost a quarter of all the years analysed, flops saw a decline in revenue. Sales growth was only 3.1 per cent (median, average 2.6 per cent). Five companies even shrank over time. Only one flop company grew by more than eight per cent per year - a brewery whose turnover was boosted by numerous takeovers. However, profits declined at the same time.
The rather meagre overall sales performance of all flop companies presumably also contributes to the lack of growth in earnings before interest and taxes: It was zero per cent (both median and average). In every third case of the 280 years analysed, EBIT fell. In addition, five companies recently incurred losses.
This was only the case once recently for the top companies - an outlier after a long series of profits for the company in question. The EBIT growth of the top companies was 17.6 per cent (median, average: 19.2 per cent). 90 per cent of the top companies increased their operating results by an average of more than eight per cent per year.
The return on investment (ROIC) was 16.3 per cent (median, average 18.2 per cent) compared to 6.4 per cent (median, average 7.4 per cent) for the flops (figure 2).
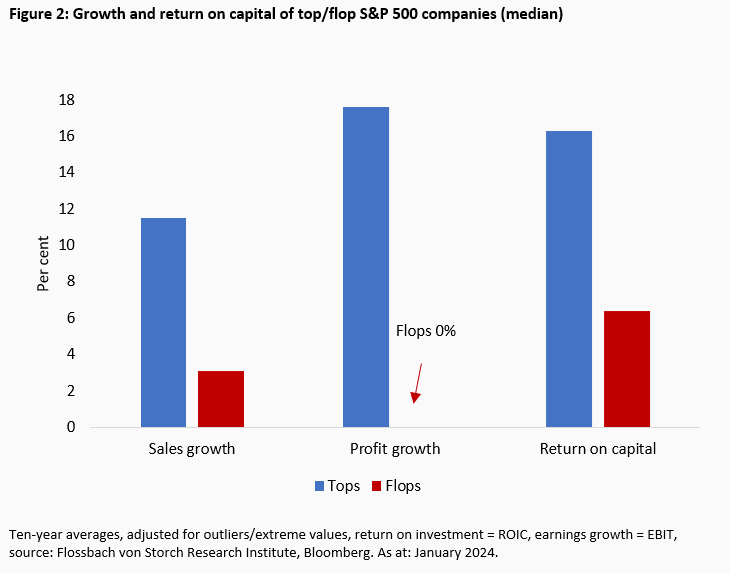
93 per cent of the top companies achieved an ROIC of more than ten per cent, compared to only 28 per cent of the flops.
There are also clear differences in the debt ratios over the ten-year period. The top companies would have to spend a median of 32 (average 68) per cent of annual EBITDA to repay their debts. This corresponds to a debt repayment period of just four months. For the flops, on the other hand, this range widens to 3.5 years (median, average: just over three years).
The median of all top companies shows a minimal net cash position compared to equity, while the flops have a debt ratio of 100 per cent (average 148 per cent).
When it comes to converting EBITDA into cash, the top performers do exactly twice as well as the flops with an average ratio of 62 per cent. The median comparison is just under 61 per cent to just under 40 per cent (figure 3).
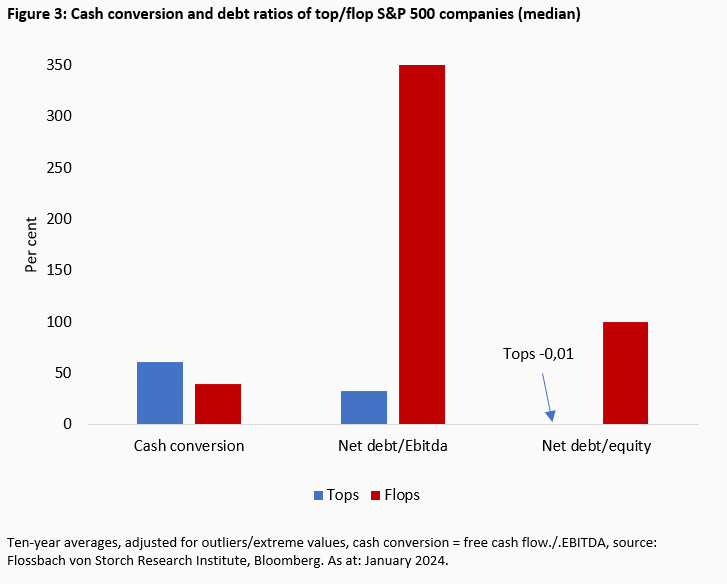
8 out of 43 top companies had an average debt ratio of more than twice EBITDA over the years. Less than a fifth of the top companies had net debt in excess of equity, while this was the case for just under half of the flops.
The overall picture shows that not all top companies always performed better in all categories over the ten-year period compared to every single flop company in every category.
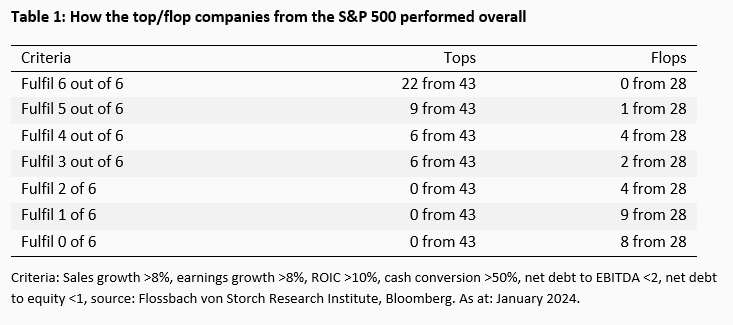
However, none of the flop companies met very high standards, but 22 of the 43 top companies did. They achieved more than eight per cent sales and profit growth at the same time, their return on investment averaged more than ten per cent and their cash conversion was over 50 per cent. Net debt to EBITDA was below a factor of two, and to equity below a factor of one. 21 out of 28 flop companies fulfilled none to a maximum of two of the characteristics, all top companies fulfilled at least three of the six characteristics (see table 1).
The flop with five positive characteristics is a large biotech company. It could be that a possibly less promising drug pipeline or disappointing trial results had a negative impact on the share price. But that is another speculative, simple thought.
Compared to the S&P 500, the Stoxx600 excluding financial groups shows a high number of stocks that are notoriously poor performers, both in absolute and relative terms. Out of a preselected 325, this figure is almost 25 per cent at 81 (S&P 500: a good 8 per cent). In addition, only 20 companies are top performers in absolute terms (a good 6 per cent of the shortlist, S&P 500 just under 13 per cent). The generally recognised weaker performance of European equities compared to US equities is therefore also confirmed here.
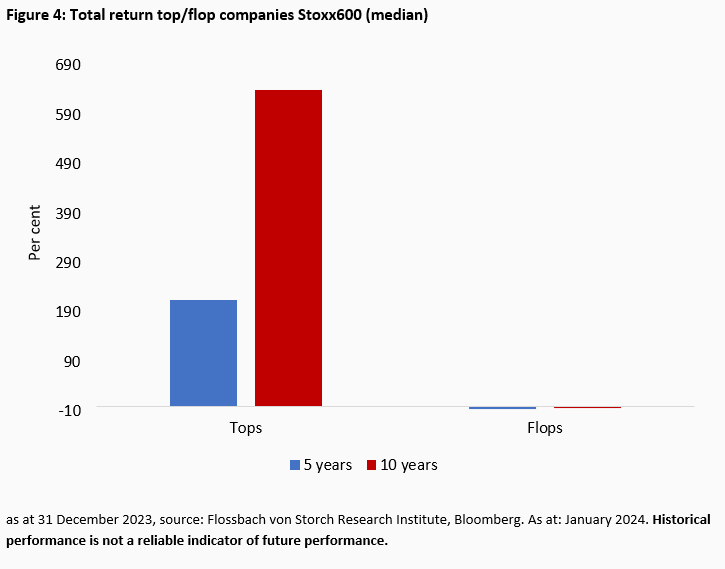
The flops from the Stoxx600 achieved a negative total return of minus four per cent (ten years) and minus six per cent (five years) on both average and median. The tops achieved a median of 640 (average 664) per cent over ten years and 215 (average 256) per cent over five years (figure 4).
The top companies recorded annual sales growth of 7.8 per cent (median, average 9.1 per cent). Turnover declined in exactly one fifth of the years analysed. All companies had positive growth over the period, with 40 per cent growing by an average of more than eight per cent per year.
In the case of flops, revenue fell in more than a third of all years analysed. Sales growth was only 2.6 per cent (median, average 2.8 per cent). 18 companies shrank. Six per cent of the companies grew strongly by more than eight per cent per year.
On average, the flops suffered declines in profits in almost every second year, while the tops saw declining earnings in every fourth year on average. Profit growth was 15.1 per cent (median, average 15.6 per cent). The flop companies did not grow at all (median, average 0.1 per cent).
The return on investment for the top companies was 13.2 per cent (median, average 16.2 per cent). The flop companies achieved 4.2 per cent (median, average 7.2 per cent, figure 5).
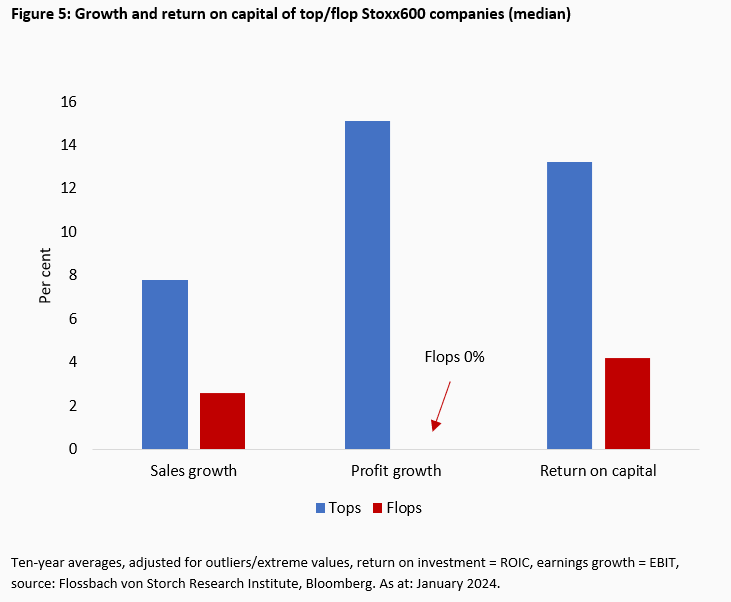
Four-fifths of the top companies achieved average returns on capital of more than ten per cent, compared with just under one-fifth of the flops.
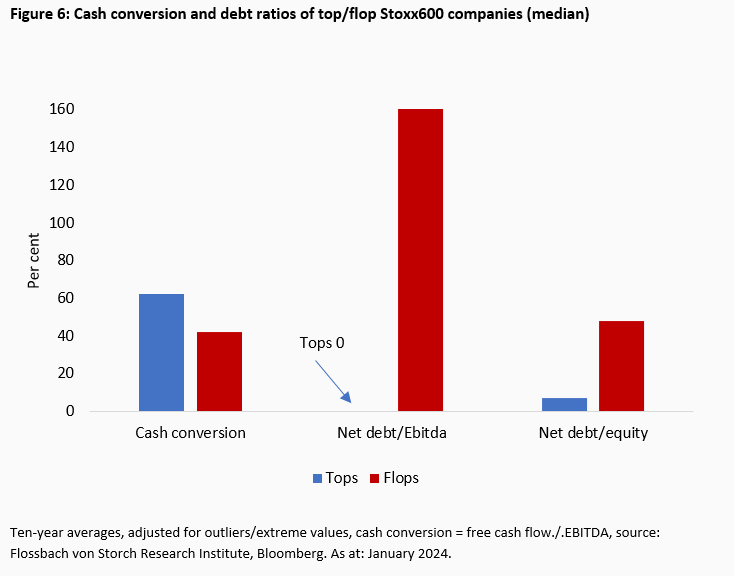
Across all top companies, net debt to EBITDA was barely measurable (rounded zero per cent at the median and average). Compared to equity, the figure was very low at nine per cent (median, average seven per cent). The flops had values of 220 per cent (median, average 160 per cent) for debt to EBITDA and 53 per cent (median, average 48 per cent) for debt to equity.
In terms of cash conversion, the figures for the tops are 61 per cent (median, average 62 per cent) and 32 per cent (median, average 42 per cent, figure 6).
No flop company fulfilled more than four criteria, while 13 out of 20 top companies cleared five or six hurdles and all top companies fulfilled at least three criteria. In contrast, more than two thirds of the flops did not (table 2).
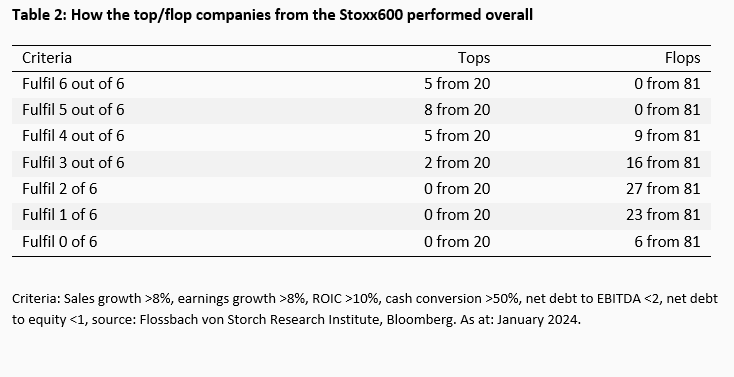
On closer inspection, the fact that 25 out of 81 flop companies in the Stoxx600 fulfil three or four criteria is primarily due to relatively good debt ratios.
The characteristics provide an indication of the companies' business performance and balance sheet stability, which can be seen here as an example in debt ratios.
But how were the companies valued on the stock market? A brief look at one of the most important key figures, the price/earnings ratio (P/E ratio), could give you an idea.
Measured by five-year averages, the top companies in the S&P 500 were consistently valued higher than the flops. This has been the case for the Stoxx600 tops since 2020. Most recently, the average of the S&P 500 tops reached a high level of more than 31. The Stoxx600 tops are just below this level. Both groups have a widening valuation in common (figure 7).
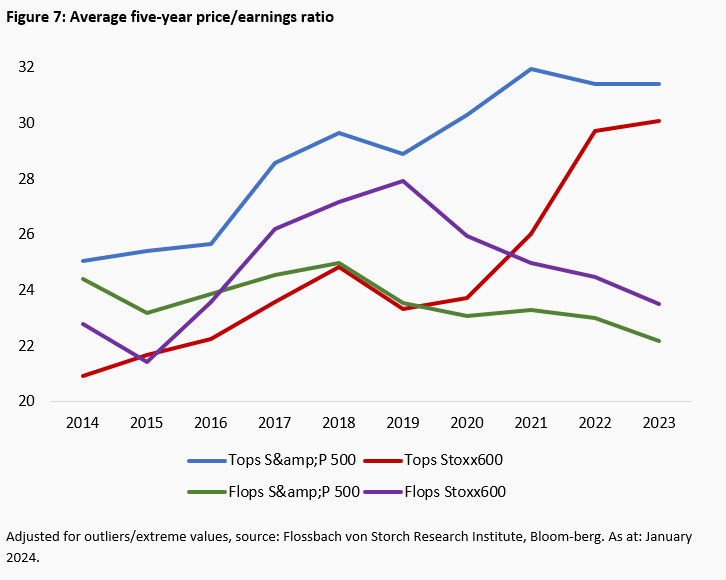
Although the flops do not come close to this valuation, the P/E ratios were consistently above a value of 20 in their five-year averages - and thus above the historical averages of the overall indices (weighted by market capitalisation).
If you look at the expected P/E ratio for the next four quarters, you will see a value of 25.1 for the tops of the S&P 500 and 16.4 for the flops. At the time of the survey, the S&P 500 itself was valued at an expected P/E ratio of 19.7 for the year 2024. The S&P 500 equal weight, in which all stocks are given the same weight, had a P/E ratio of 16.1. The Stoxx600 traded on a 2024 P/E ratio of 12.6. The tops came in at 23.7 and the flops at 14.9.
In general, it can therefore be said that both tops and flops are currently trading below their most recent five-year averages on a forward-looking annual basis, but all groups are trading above their respective expected index averages.
In retrospect, companies that perform well above average on the stock market also regularly fulfil quality characteristics in terms of growth, return on capital or debt ratios, for example. A large number of companies, particularly from the S&P 500, fulfil all or almost all of the criteria considered. All top performers fulfil at least three characteristics.
Companies that perform very poorly on the stock market regularly have significantly fewer or no quality characteristics. Only one flop company from both indices fulfilled five out of six characteristics.
On the one hand, this shows that an individual analysis is indispensable. On the other hand, it would be possible to check in individual cases whether the correlations shown here also apply to a selected individual share or to another basket of shares, which would possibly allow conclusions to be drawn in comparison with their performance.


Legal notice
The information contained and opinions expressed in this document reflect the views of the author at the time of publication and are subject to change without prior notice. Forward-looking statements reflect the judgement and future expectations of the author. The opinions and expectations found in this document may differ from estimations found in other documents of Flossbach von Storch SE. The above information is provided for informational purposes only and without any obligation, whether contractual or otherwise. This document does not constitute an offer to sell, purchase or subscribe to securities or other assets. The information and estimates contained herein do not constitute investment advice or any other form of recommendation. All information has been compiled with care. However, no guarantee is given as to the accuracy and completeness of information and no liability is accepted. Past performance is not a reliable indicator of future performance. All authorial rights and other rights, titles and claims (including copyrights, brands, patents, intellectual property rights and other rights) to, for and from all the information in this publication are subject, without restriction, to the applicable provisions and property rights of the registered owners. You do not acquire any rights to the contents. Copyright for contents created and published by Flossbach von Storch SE remains solely with Flossbach von Storch SE. Such content may not be reproduced or used in full or in part without the written approval of Flossbach von Storch SE.
Reprinting or making the content publicly available – in particular by including it in third-party websites – together with reproduction on data storage devices of any kind requires the prior written consent of Flossbach von Storch SE.
© 2024 Flossbach von Storch. All rights reserved.

Christof Schürmann
Senior Research Analyst
At the Institute since 2022. The graduate in business administration (FH), previously worked as a journalist and deputy head of "Money" at WirtschaftsWoche. The trained banker and book author ("Die Bilanztrickser") taught balance sheet research part-time at the private university BiTS in Iserlohn.
All articles by Christof Schürmann