21.12.2022 - Studies

At the end of September 30-year British government bonds suffered price losses of more than 20 percent within a few days. The unexpected slide in the prices of these supposedly safe assets raises the question of where further shoals might lurk in the European and international financial system.
This is an attempt to create a map of financial risks. The map can only be incomplete for two reasons: (1) Because we may have overlooked identifiable risks, and (2) Because there is an unknown set of ex-ante unidentifiable risks (the "unknown unknowns"). However, the uncertainty in principle does not release us from the obligation to name and assess identifiable risks.
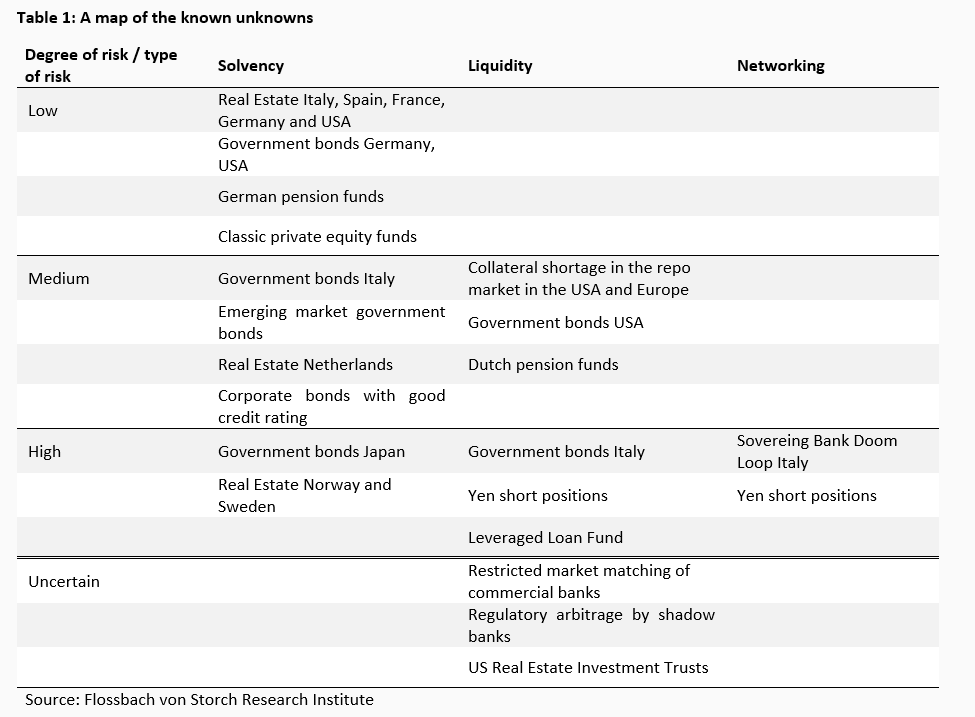
We sort the risks we identify according to three categories: First, solvency and how possible developments affect the (balance sheet) value of assets. Secondly, liquidity and the ability or necessity to meet payment obligations in the short term. Thirdly, the degree of interconnectedness of debtors and creditors must be considered. Losses limited to a few market participants, as in the current downturn of the crypto exchanges, are less dangerous than a possible default of the pension provision of all pensioners of an internationally interconnected economy, as it came to light in the aforementioned crisis surrounding British government bonds. In the individual categories we distinguish between low, medium, high and uncertain. We always choose the latter category when historical or quantitative classifications seem too speculative.
It is unrealistic to uncover all the still hidden high-risk areas in this way. However, coastlines of an unknown territory can be sketched. In the following, we justify our assessments from the above map individually.
We start in Italy and then work our way through Japan to the repo markets and related topics. We then look at emerging markets and real estate and take a detour to corporate bonds and in particular loans of heavily indebted companies, so-called "leveraged loans". This is followed by considerations on (Dutch) pension funds and (German) Pensionskassen as well as (classic) private equity. Finally, we look at the (little-regulated) shadow banking sector in general and take a look at American real estate investment trusts (REITs) in particular.
The South is significantly more indebted than the North - but Central Europe has also caught up
An obvious risk (also geographically) is sovereign debt in Europe, with Italy at the forefront. The debt levels of Europe's states vary considerably. In the South, the debt in relation to GDP is many times higher than in the North. In absolute terms, Italy is in the same league as the much larger economies of France and Germany (Chart 1).
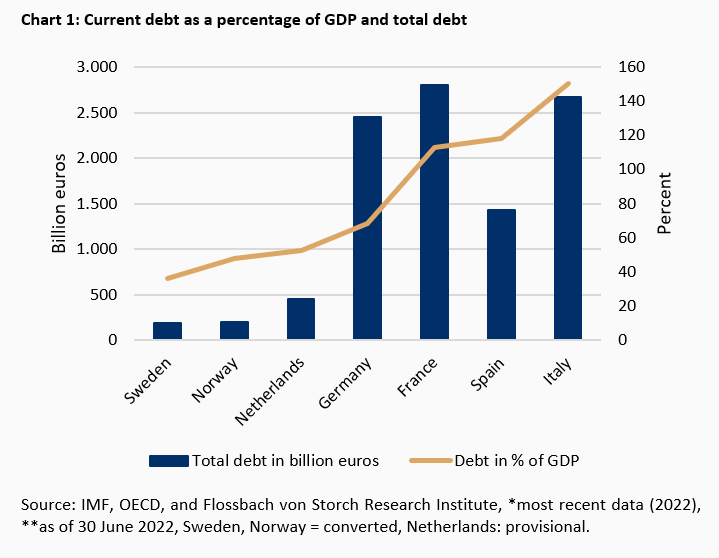
Italy, the third largest economy in the EU with 150 percent debt, has outstanding debts of almost 2.7 trillion euros. As a member of the EMU, Italy theoretically does not have its own central bank that can create money for the state in the event of liquidity or solvency crises. In practice, however, the European Central Bank has taken over this role. But whether it will also create money for Italy in the event of high inflation is unclear. Against this background, France, with a debt ratio of 113 percent and total debt of a good 3.2 trillion euros, is also a cause for concern as the second largest economy. Norway and Sweden rank at the lower end of the scale with ratios below 50 percent and have their own central banks. Germany is (still) in the middle. We therefore still see the greatest risk in Italian government bonds and will look there in more detail in the next sections.
The Roman Risk Roulette
The story of "sovereigns dragging banks into bankruptcy because they hold too many sovereign bonds" began during the financial crisis and is not over yet. The "sovereign-bank doom loop" is currently in its umpteenth turn and despite all the efforts of the regulators and the ECB, there is no certainty that the train will not fly out of the Chart eight.
Italy is an example of a problem that can hardly be solved. For the financiers of the debt are domestic banks as well as the European Central Bank (ECB). Italian government bonds account for almost ten percent of the assets of all Italian banks (Chart 2).
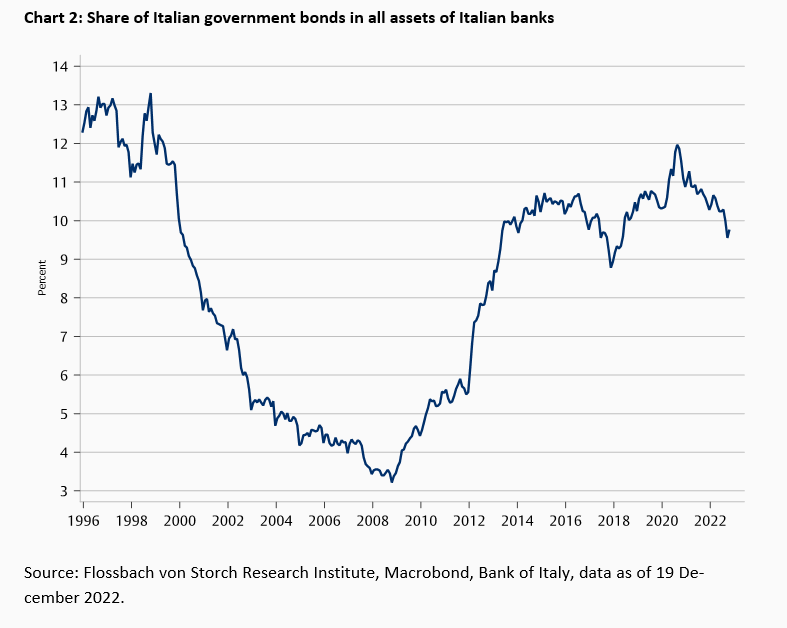
Doubts about the Italian government's liquidity could widen spreads against German Bunds, for example. If interest rates rise, a liquidity crisis can quickly turn into a solvency crisis. Due to enormous leeway in accounting, however, banks are able to delay devaluations for a very long time. Even in the case of Greek bonds, which were on the verge of default at the height of the euro crisis a good decade ago, investigations revealed different applications of the balance sheet rules on the part of the banks.1
Risk refinancing in 2023
The possibly greater risk therefore lies in the refinancing of maturing bonds. Including converted foreign currency bonds, about 367 billion euros of bonds will mature next year (Chart 3).
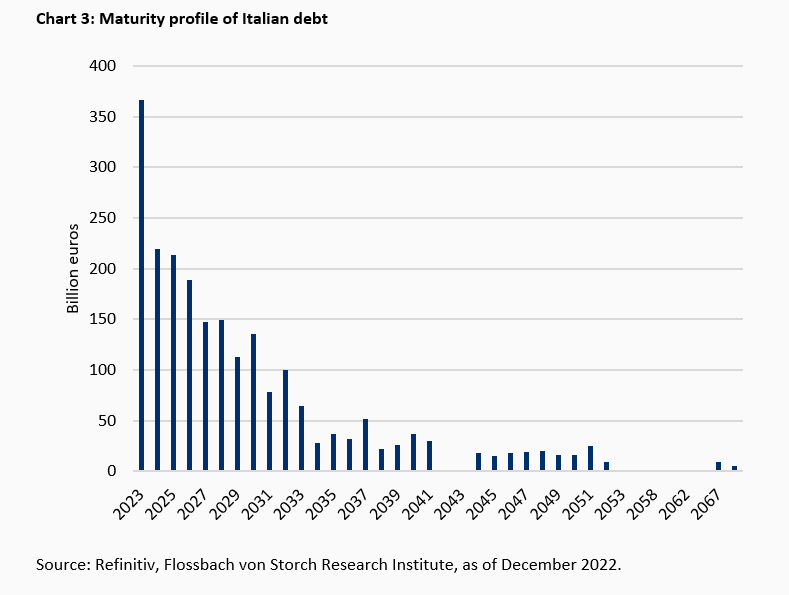
In the case of the classic, longer-dated BTP bonds that banks usually take on their books, around 260 billion euros will fall due, including two floating-rate EU Treasury certificates for just under 21 billion euros. But it is not only the 260 billion euros of maturing BTPs that have to be replaced. There is also the government deficit, which the OECD estimates at 94.5 billion euros for 2023. Logically, Rome must finance the deficit with new debt.
In addition, the ECB will shrink its balance sheet. Bonds with an estimated volume of 270 billion euros from the PSPP programme will fall due next year. According to the capital key, around 14 percent of these are likely to be Italian bonds. If the ECB stops investing half of the repayments, this would mean a further financing requirement for Rome of around 19 billion. If you add the maturing BTPs and the government deficit, you get a total of 373.5 billion euros in longer-term financing needs.
If the variable portion and the portion of the low foreign-currency debt remain constant at 108 billion euros in absolute terms, the total amount that creditors will have to make available to Rome next year will be 481.5 billion euros. The extent to which the domestic banking sector would be willing to take on additional debt is just as much an open question as the interest rates that Italy will have to offer on the already unsettled bond market in view of such sums.
Observing the latest interventions of the ECB, it becomes clear that this risk is also seen there as a real threat to economic development in Italy and - due to "contagion" - other highly indebted countries in the Eurozone. Expiring bonds from Germany, France and the Netherlands were reinvested in Italy, Spain and Greece under the PEPP.2 The new "transmission protection instrument", TPI for short, allows the ECB to buy bonds of individual eurozone countries with very few restrictions:
"Subject to fulfilling established criteria, the Eurosystem will be able to make secondary market purchases of securities issued in jurisdictions experiencing a deterioration in financing conditions not warranted by country-specific fundamentals, to counter risks to the transmission mechanism to the extent necessary." 3
The tight chaining of the eurozone states via the common currency leaves the ECB no choice but to use all its might to slow down the rates of interest rate changes. A commentary on TPI by our colleague Thomas Mayer can be found on our website: https://www.flossbachvonstorch-researchinstitute.com/de/kommentare/die-abschalteinrichtung-der-ezb/
Is there danger from the yen?
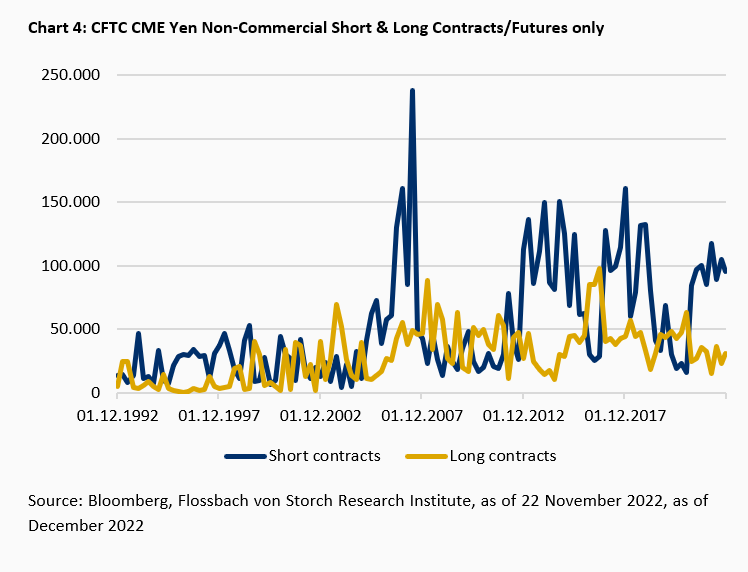
We now turn to the Japanese economy, which is taking a special path in terms of interest rates compared to other leading industrial nations. The traditionally very low-yielding Japanese yen is often used for so-called carry trades. Market participants borrow in yen to invest in higher-yielding currencies, especially the US dollar. This year, this game has paid off. The yen lost about a fifth of its value against the dollar from the beginning of the year to October. Even against the euro, which is also rather weak, the yen lost double digits.
But since the October low, the yen has turned around, at least for now. Here, in the world's third most important convertible currency, risks could arise. For on the Chicago Mercantile Exchange (CME), non-commercial investors are currently betting three times more on falling yen rates than on rising ones (Chart 4).
Japan is the most indebted industrialised country in the world
In addition, Japan is the most indebted of the major industrialised nations, with a government deficit to gross domestic product of a good 260 percent (Chart 5).
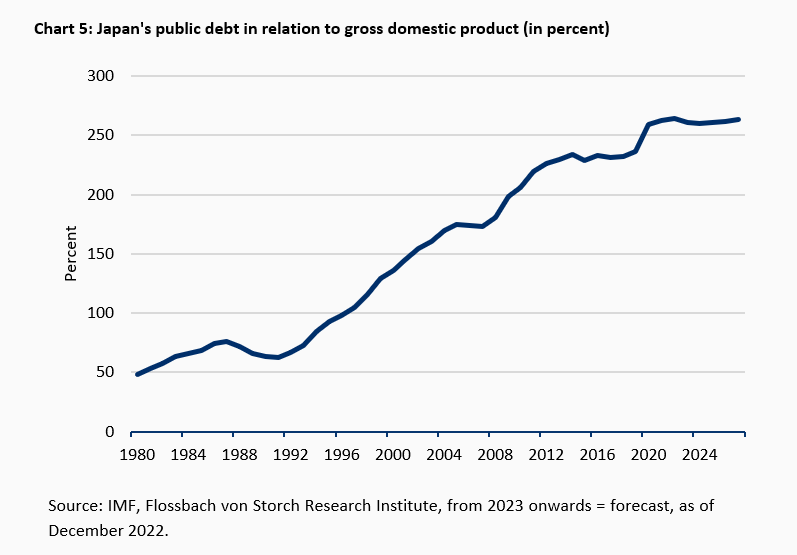
But Japan has an advantage: only 13 percent of this debt was held abroad as of the end of June 2022. Thus, unlike Italy or Germany, Japan and its central bank hold the reins. However, should Japan abandon its zero-interest rate policy after decades, capital is likely to flow in from abroad, strengthening the yen and killing the yen carry trade (see above). This in turn could lead to a liquidity crisis worldwide, with repercussions for global equity and bond markets.
Domestically, rising interest rates would quickly lead to speculation about the solvency of the Japanese government due to politically unsustainable high interest expenditure. In addition, holders of Japanese government bonds would suffer valuation losses if interest rates rose. This is likely to affect the Bank of Japan in particular. The extent to which a loss of capital by the Bank of Japan undermines confidence in the currency is uncertain.
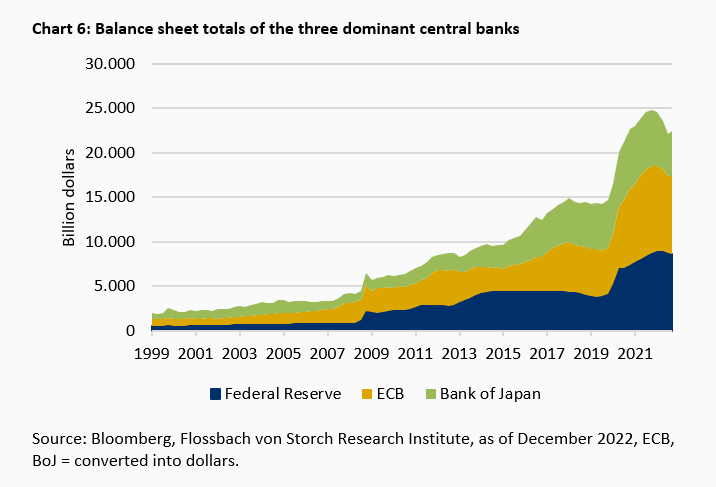
What is clear is that central banks around the world have started to shrink their balance sheets by selling bonds, sometimes more sometimes less quickly, but still visibly (Chart 6). However, it is questionable whether this will solve the lack of credit collateral in the form of government bonds in the financial market.
The (reverse) repo market in the U.S.
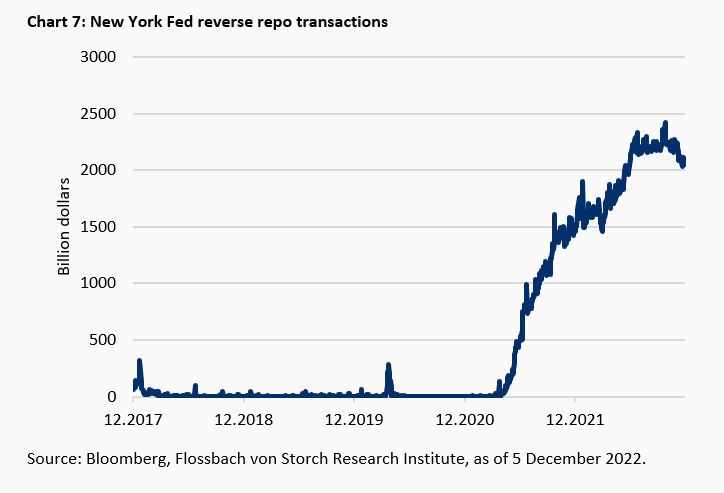
As of 30 November, the Federal Reserve had 8,195 billion dollars in interest-bearing securities on its books. Essentially, these were long-dated US Treasury notes and bonds for 4,759 billion, mortgage-backed securities for 2,661 billion, inflation-hedged Treasuries for 376 billion and short-dated T-bills for 296 billion dollars. These securities are withdrawn from the market as collateral.
This dries up the little-noticed but important market for collateralised loans (repurchase or repo loans for short). This is an important lubricant in daily trading, as repo transactions allow investors to take out short-term cash loans against the assets they hold.
The machine has not been running like clockwork for a long time. This is shown by the so-called reverse repo transactions, which the local New York Federal Reserve carries out to support the central bank policy of the national Washington Federal Reserve (Fed). In these transactions, financial institutions that have access to the Federal Reserve borrow papers from the Fed's holdings for a fixed term in exchange for central bank money in order to use them as collateral for borrowing to create liquidity.
Counterparties for the special transactions of the New York Fed are banks such as Goldman Sachs or Citibank, plus money market funds from Blackrock or the American subsidiary of DWS and government-sponsored enterprises such as the real estate financiers Fannie Mae or Freddie Mac. The total circle is currently limited to 99 counterparties.
In the past two years, these reserve repos have risen massively from a negligible size. Most recently, the New York Fed lent out about a quarter of all securities held by the Federal Reserve (Chart 7).
At the same time, the experience at the beginning of the pandemic in 2020 has shown that raising liquidity by selling Treasuries from banks' holdings can also lead to shortages because there are suddenly more sellers than buyers of Treasuries.4 Interventions by the Fed in the Treasury market therefore seem to have become a necessary component to secure the liquidity of financial institutions.
The European repo market probably lacks even more liquidity
Unlike the Federal Reserve, the European Central Bank (ECB) is reluctant to give shadow banks such as money market funds access to its lending and deposit windows for central bank money. This could be a mistake, as a significant volume of banking business has moved to shadow banks due to the strict regulation of the banking sector (see also the separate section on shadow banks).
Secretly, however, the European Central Bank has eased the restrictions on its securities lending operations to counter the shortage of collateral in the repo markets. It made the decision to do so during a non-monetary policy meeting on 9 November 2022, according to which the maximum volume of securities that the ECB can lend in aggregate against central bank money has risen from €150 billion to €250 billion.5 In an unusual move, the ECB made no official announcement after the decision.
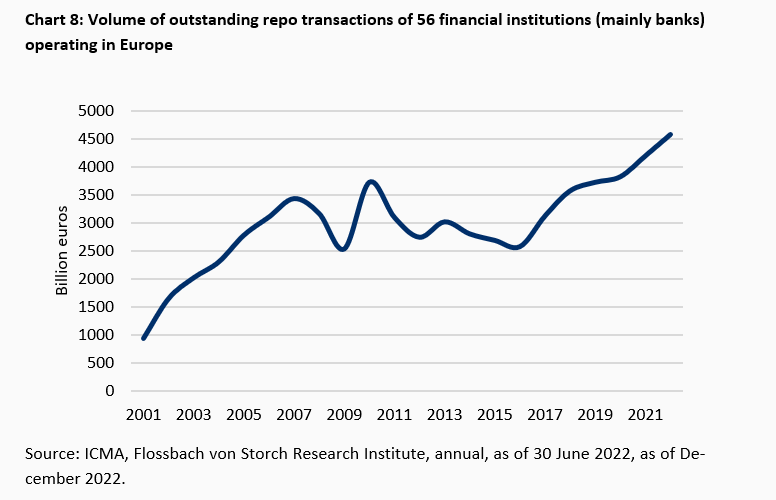
According to the Financial Times, the International Capital Markets Association (ICMA), an international trade association for capital market participants based in Zurich, is calling on the ECB to launch much more extensive reverse repo programmes, like the Fed.6 Reason: The significant increases in interest rates could lead to a lack of liquidity. The lack of safe short-term securities could damage the euro area repo market, ICMA, which represents the largest players in the global bond markets, warned already at the beginning of the year. The repo transactions of 56 financial institutions alone, which participated in a study by the ICMA, were worth an enormous 4.6 trillion euros at last count (Chart 8).
Market-matching capabilities of banks are increasingly restricted by regulation
An additional brake on liquidity in the securities markets is that, due to stricter regulations after the financial crisis, banks in all markets regularly no longer act as managers of trading portfolios that could balance out the ebbs and flows on the stock exchanges. They now only act as intermediaries between buyers and sellers, thus often only taking on pure brokerage functions.
However, it is difficult to predict to what extent this lack of so-called market matching, in which banks take securities such as shares or bonds into stock or sell them from stock and thus provide liquidity, will contribute to crises in markets.
Emerging markets under pressure
The yield on US Treasuries, along with the Federal Reserve's key interest rate, is decisive for large parts of the global bond market. It affects the US mortgage rate as well as the interest rates paid by foreign borrowers who have borrowed in US dollars.
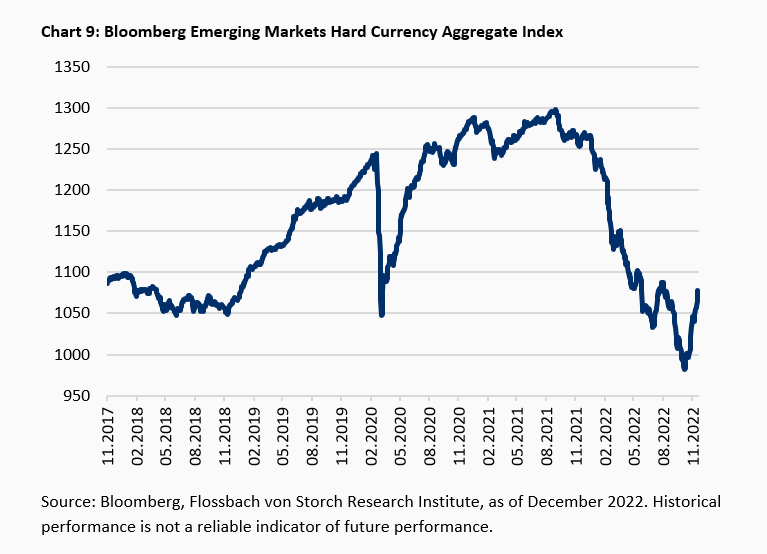
Higher yields mean falling prices for securities already circulating on the market. The Bloomberg Emerging Markets Hard Currency Aggregate Index, for example, fell sharply in the wake of significantly higher refinancing rates. The broad index includes sovereign, sub-sovereign and corporate dollar borrowers from emerging markets (Chart 9).
In addition to the significant rise in yields, the strength of the dollar also threatens the repayment capacity of many countries. The higher the dollar's exchange rate, the more expensive it becomes for debtors to exchange their home currency for dollars in order to service their loans.
And creditworthiness is often not that good anyway. For example, 87 out of 185 sovereign debtors worldwide have a junk rating or no rating at all for their loans denominated in foreign currency. Investors have therefore already taken flight. According to J.P. Morgan, investors have already withdrawn 70 billion dollars from emerging market bond funds this year. That would be the largest outflow of funds since data collection began in 2005.7
Real estate as a "safe" investment - the case is not quite so clear-cut
We now turn to the European real estate market. Real estate in particular is widely regarded as a "safe" investment. Asset accumulation based on this type of investment is seemingly risk-free. Yet there are good reasons to subject this asset class to critical scrutiny.
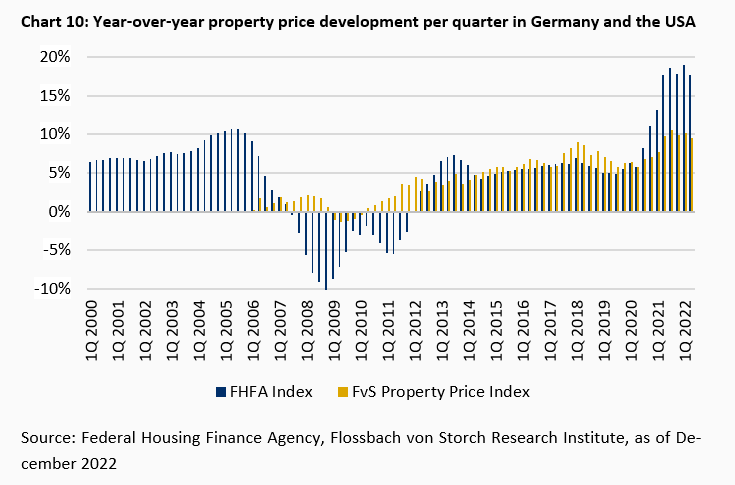
The enormous price increases of German real estate in recent years are well documented in the FvS Asset Price Index.8 The American FHFA US House Price Index has also tripled since 2000, despite the subprime crisis of 2007 to 2009.9 In other words, real estate has generated a return of around five percent per year over the past 20 years (Chart 10).
These are returns that are known from investments classified as risky, such as shares. So, is this an asset class that offers "safe" profits in the number of risky investments? Or to put it another way: Are there arguments that real estate can also suffer losses in value of 20 to 30 percent within a short period of time, as is known from the stock market? Those who did not invest directly in real estate in the past, but in shares of real estate groups, have already had exactly this experience (Chart 11).
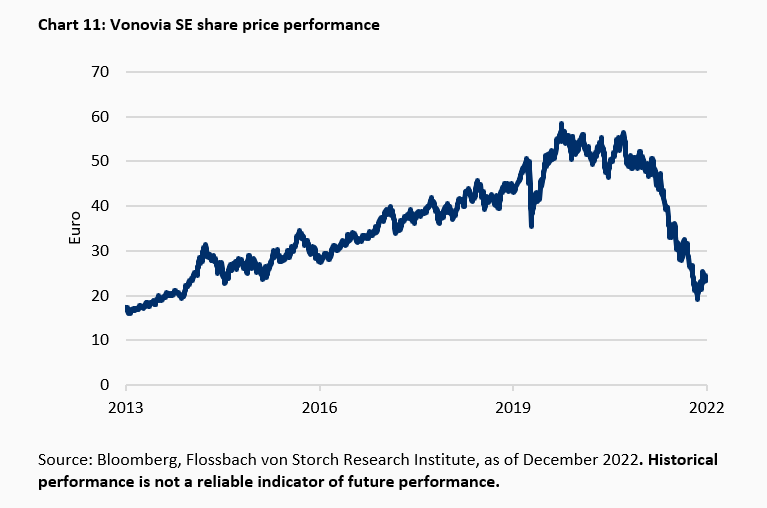
In the period from the beginning of 2014 to autumn 2021, the share price of Vonovia, Germany's largest real estate company, had tripled. Since autumn 2021, it has halved.
The American Nobel Prize winner Robert Shiller suspects falling prices for the American real estate market and recalls in particular the years 2005 to 2012 in an article for the New York Times of 28 September 2022:
"I think that real (inflation adjusted) home prices will likely be a lot lower in a few years, but this is not certain. After real home prices peaked in December 2005, they fell 36 percent by February 2012. But it took over six years to drop that much, and real prices then shot up 77 percent from February 2012 to June 2022.10
He sees the "fear of missing out", i.e., missing out on the supposed dream home due to inactivity, as one of the main reasons for the rapid price increase. This drives people to make hectic buying decisions. A phenomenon that is particularly widespread in the purchase of single-family homes, since inexperienced buyers usually appear there.
So, there are examples that speak against classifying real estate as a safe investment. Price or value losses cannot be ruled out. When buying a home, Robert Shiller advises to look at the investment from a different angle:
"If you think you are in love today with a house, one could well argue that acquiring it right now makes sense. But this is clear only if in your heart you are really in love with it."
For property owners and loans, the risks are in Northern Europe
But who bears the risks in the real estate sector? Interest rate increases hit property owners especially when the outstanding loan burden is high compared to income and the duration of the fixed interest rate is low. A European comparison first shows the different ownership structures in the individual European countries (Chart 12).
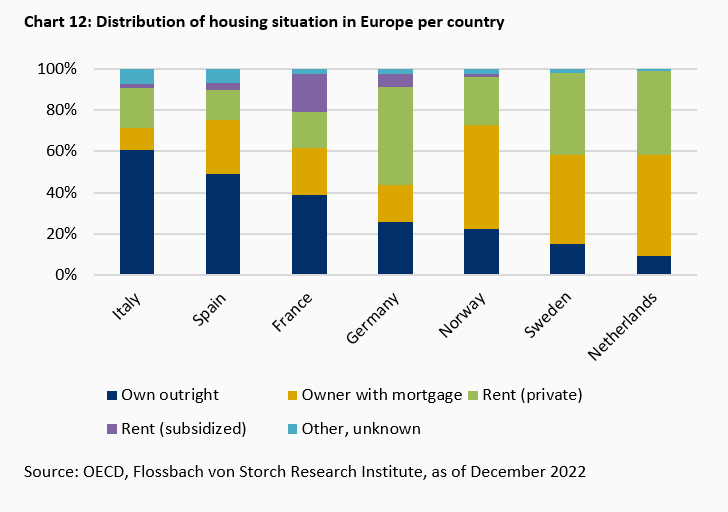
In Southern Europe, more people live in their own property than in the North. Since there are only minor credit obligations, there is also no interest rate risk for these people - losses in value on the real estate market also hardly affect them. Should they want to "swap" their house for another, prices have probably hardly changed in relation to each other. Moreover, there is always the possibility of staying in one's own house - which, however, brings some low-income earners or pensioners a negative cash flow due to taxes, levies, and maintenance expenses. In Norway, Sweden, and the Netherlands, on the other hand, more than 40 percent of people live in a property that is encumbered with a loan.
In a European comparison, changes in interest rates have a direct impact on loans, especially in Norway and Sweden. In Sweden, more than 40 percent of the loans issued in 2021 have a fixed interest rate of one year or less. In Norway, the share is over 90 percent (Chart 13).
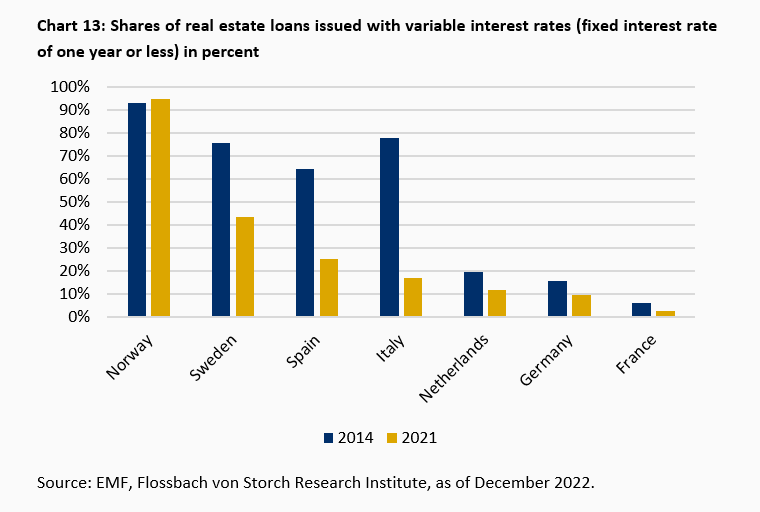
Moreover, the Norwegians are the only one of the nations studied not to have joined the trend of reducing this share.
It thus remains to be clarified whether the loans can continue to be serviced even if interest rates rise. Otherwise, there is a risk of losing the property while at the same time the outstanding loan amount is not covered. We compare the outstanding loan amounts with the annual disposable income (Chart 14).
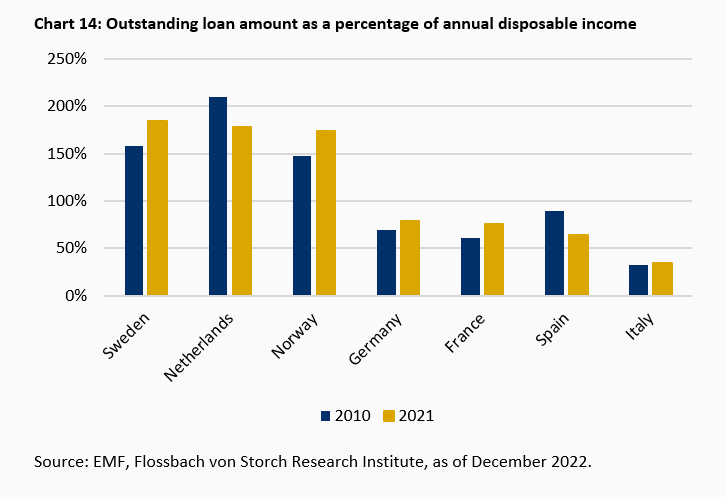
Here, too, we find Sweden and Norway among the frontrunners. Per capita, people there are in debt by almost two disposable annual incomes. The fact that this situation can quickly become a problem, especially in economically uncertain times, is shown by the possibility granted by the Swedish Financial Market Authority to suspend the repayment of real estate loans from April 2020 to June 2021: Banks and borrowers could agree to temporarily suspend the legally required annual minimum repayment of one to three percent of the loan amount.
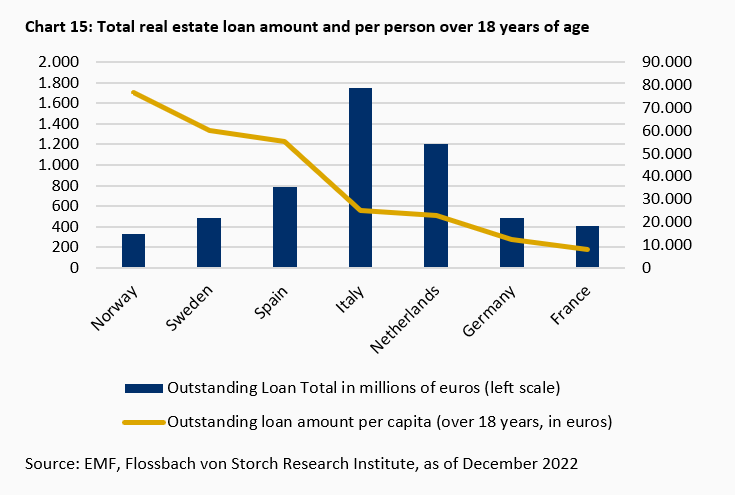
In real estate, we have already seen above a trend towards longer-term fixed interest rates in Central Europe. The loans in Norway and Sweden, which tend to be more vulnerable, are also the front-runners in Europe in per capita terms. In absolute terms, however, the risk remains manageable at a good EUR 800 million (Chart 15). For comparison: the outstanding real estate loans in the USA at the beginning of 2007 amounted to approximately ten trillion dollars.11 Moreover, neither Sweden nor Norway is in the European currency area, which can further dampen the spread of shock waves.
In the real estate sector, a North-South divide can be observed with regard to risk. Or to put it simply: The Italians are increasingly living in their own, debt-free house, while the Norwegians and Swedes, instead of paying rent, are paying off a loan whose interest burden can be subject to strong fluctuations.
Since politicians are currently also keeping ancillary housing costs artificially low throughout Europe by means of subsidies, thus taking additional pressure off the loans, an open flank on the real estate side is currently only discernible in the far north of Europe.
To conclude the section on real estate, let's look at the USA, where subprime real estate loans triggered the last major economic crisis in 2007/08. Traditionally, adjustable-rate mortgage loans were very popular in the USA shortly after the turn of the millennium. However, this has changed (Chart 16).
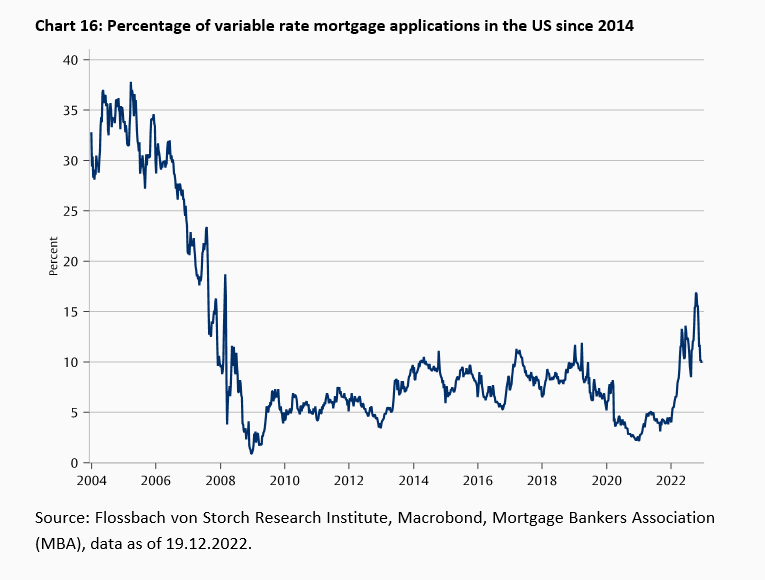
Today, only just under ten percent of the real estate loans issued and 17 percent of the loan amounts issued are subject to interest rate adjustments.12 At the same time, debt as a percentage of disposable annual income fell from just under 90 percent to 70 percent between 2010 and 201813 and is thus in an order of magnitude that we are familiar with from France and Germany (cf. Chart 14), where it was considered largely harmless. An exact repetition of the history of 2007/08 therefore does not seem plausible to us. However, we will outline a scenario on real estate funds later in the section on shadow banks, which could follow a similar dynamic.
Bonds have been in calm waters in recent years. Although only low nominal interest rates could be achieved on the bond market, at least the prices were stable due to permanently low interest rates. Ideally, one could even realise slight price gains due to falling interest rates and get back one's invested capital without loss of value at any time, even before the end of the bond's maturity. This calm was mainly based on the massive influence of the central banks on the market: low key interest rates, mass bond purchases and an increase in the money supply stabilised the bond market for a long time. However, after inflation made interest rate hikes inevitable, bonds lost value in the past six months in a similar way to equities. If we compare the MSCI World with the iBoxx Eurozone Government Bond Index, we see the parallel price losses since the beginning of 2022 (Chart 17).
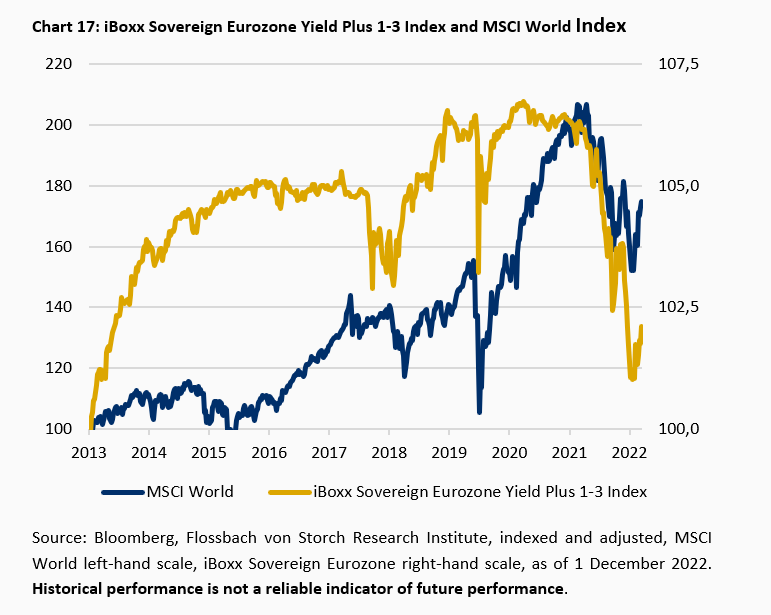
The often-heard argument that equities and bonds are negatively correlated and provide diversification proved to be false. In an article from the late summer of 2021, Bernd Meyer from the private bank Berenberg also pointed out that this correlation cannot be proven historically. Depending primarily on inflation, but also influenced by the interest rate policy of the central bank and the mood on the markets, a distinction can be made between two regimes on the capital market:
"The relationship between the performance of equities and government bonds in the US has historically been almost invariably positive at core inflation rates above 3%. Thus, in an environment of elevated and higher inflation, equities and bonds tend to behave in the same direction. By contrast, when core inflation is below 2%, equities and bonds have largely moved in opposite directions." 14
As in the case of real estate, there is thus evidence that the image of a safe haven does not apply without restriction: bonds can also be exposed to stronger fluctuations in value. Moreover, their balancing effect on an equity portfolio is not always given. Used in this sense, the term "safe" investment is misleading.
If bonds are not a safe haven, how are they distributed around the world? Is there sufficient interconnectedness for major frictions? Let's start with German government bonds as an example. In what total value do they exist and who are the buyers? The Bundesbank has compiled an overview of this for 2017 (Chart 18).
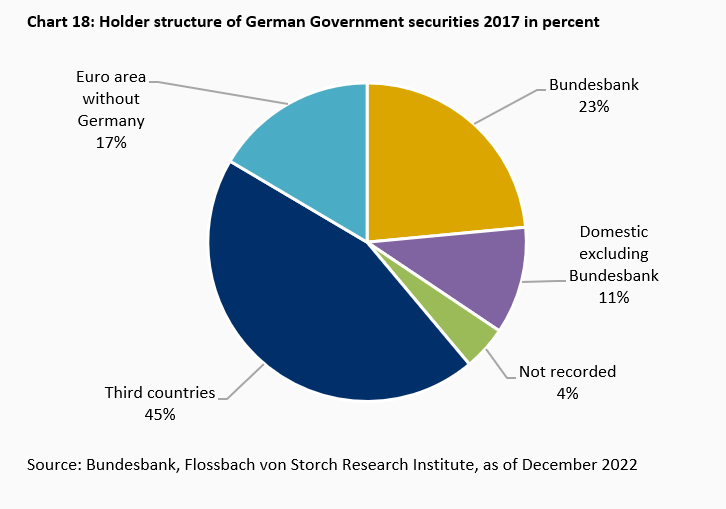
Over 40 percent are held in third countries and almost 20 percent by other EU countries. 30 percent remain in Germany. German government bonds are thus held internationally. This means that they are particularly more strongly networked in the financial sector than their British counterparts, for example.
Only 28 percent of these are in foreign ownership.15 A rapid decline in the value of German government bonds would therefore have a global impact. These considerations apply even more to US government bonds, which are used worldwide as a "safe investment".
Since 1990, the debt of companies with a good to very good credit rating (so-called investment grade) has increased by a factor of 15 to 63.6 trillion dollars, as measured by the Bloomberg Aggregate Corporate Debt Index (Chart 19).
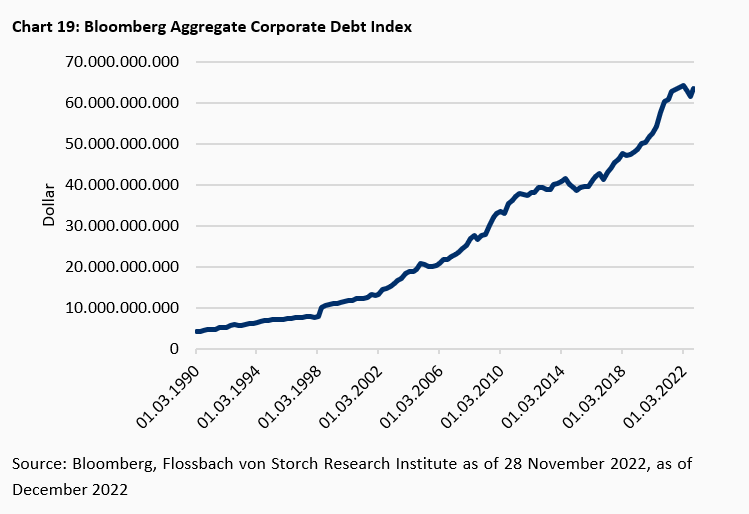
Since then, the world's gross domestic product has only increased by a factor of about five. The high debts will probably have to be refinanced for the most part, should cash inflows from the businesses of the companies or other sources of financing such as equity capital is not able to be used to cover them.
Within five years, including 2022, eleven trillion dollars will be available for refinancing from the Standard & Poor's universe alone, which covers by far the largest share of corporate ratings, of which almost 2.9 trillion dollars will come from the junk class, i.e., from companies with a weak credit rating.
These are high volumes that meet with significantly higher interest demands from creditors. The reason for this is the significantly higher yield levels of almost all bonds in the wake of the central banks' interest rate hikes.
The aggregate global key interest rate, weighted according to the size of the economies, has risen from its low of below two percent in 2021 to around 4.7 percent most recently. In parallel, the refinancing costs for junk bonds rose by an average of 2.2 percentage points over the course of the year. At its peak this autumn, the premium was already a good three percentage points.
Debt has increased everywhere. Households, corporations, the financial sector and governments have added more thandollars80 trillion dollars in new debt over the past decade. The total as of the end of March 2022 was dollars305 trillion. By comparison, world gross domestic product is expected to be dollars104 trillion this year.
On the bond market, the price losses this year added up to double-digit trillions. An individual case demonstrates the crash: Two years ago, anyone who bought a bond of a large European telecom company with a term of almost 20 years, which was considered to be quite safe from default, lost 40 percent at the peak. In contrast, the share price of this company increased by 30 percent over the same period.
Since the end of the financial crisis in 2009, the market for risky corporate loans has also grown steadily. Driven by low interest rates, the outstanding loan amount for so-called leveraged loans in particular grew from just under three trillion to almost six trillion dollars in 2019.16 Colloquially, these are loans that are taken out by companies that have debt significantly above the industry standard.17 The interest rate on these should be at least 125 basis points above the short-term LIBOR (London Interbank Offered rates) if the borrower is rated BB+ or worse, according to S&P. Default rates are usually in the order of 20 percent.
Due to stricter bank regulation, the business with leveraged loans has migrated to the sector of so-called shadow banks (non-bank financial institutions). Parts of these loans are traded on the capital market via so-called CLOs (collateralised loan obligations). The market grew from 400 billion to almost 800 billion between 2009 and 2019. While half of the leveraged loans were still held by banks and shadow banks at the turn of the millennium, more than 90 percent are now in the hands of institutional investors outside the traditional banking sector.
Now, there are two readings of the situation: one can take the position that almost six trillion dollars of loans represent only two percent compared to the above-mentioned 305 trillion dollars of total outstanding loans and that (systemically important) banks are not involved in these transactions at all. Warnings were already issued in 2019 and even during the Corona pandemic the market did not implode. In other words: Much ado about nothing and basically everything is fine.
Or one draws the analogy to the subprime crisis: six trillion and ten trillion outstanding loans are in the same order of magnitude (see section on real estate), the acting institutions are hardly regulated, and parts of the risk were passed on to the capital market in structured products. This would create a situation similar to the one on the American real estate market immediately before the outbreak of the 2007 financial crisis.
We agree with the second argument but limit the comparison somewhat: it is unclear whether there is similar interconnectedness among institutional investors as among banks during the subprime crisis. Thus, one can only speculate what the macroeconomic impact of a crisis among some institutional investors would be. However, we will take up this idea again later in a separate section on shadow banks.
In the following, we take a look at pension funds. These were, after all, the catalyst of the crisis in the UK and mostly have fixed benefit commitments for the contributors or technically formulated provisions for future benefits at the risk of the pension fund. We focus our analysis on the Netherlands, as the reporting system there ensures a high degree of transparency, and the market is of substantial size due to the popularity of occupational pension schemes. In total, there are around 1.6 trillion euros in assets under management (AuM), of which the largest two funds together hold around 45 percent.18
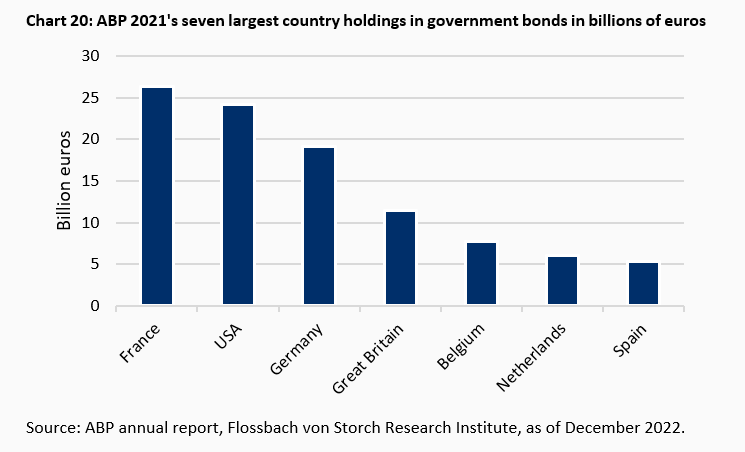
The market leader in the Netherlands is called ABP and is one of the three largest pension funds worldwide with almost 600 billion euros AuM. It has a bond ratio of 39.3 percent.19
Government bonds account for about half of the bonds and are broadly distributed across Europe and the USA.20 So for the time being, there is no cluster risk with regard to a single economy (Chart 20).
In the Netherlands, however, as in the UK, savers have in the past been promised minimum pensions, so-called "defined-benefits".21 In the case of underfunding of a pension fund, these minimum pensions can theoretically be adjusted downwards, but initially the pension fund bears the risk of inadequate returns on the investment. Moreover, an actual substantial downward adjustment of the promised benefits would presumably be perceived by savers as a breach of promise and thus harbours considerable political explosives.
Therefore, in order to hedge against interest rate cuts on bonds in particular, interest rate swaps (which can be used to receive fixed interest rates and pay variable interest rates) were widely used in the UK under the heading of "liability-driven investment". The unexpected supply glut of 30-year UK government bonds and the associated rise in interest rates led to margin calls on the swaps, which the funds were often only able to finance by selling government bonds they held. A feedback loop occurred in the price decline of the "gilts". ABP's balance sheet also includes derivatives. Their function and the handling of collateral behind them are explained as follows:
"ABP uses derivatives to mitigate risks or make rapid tactical changes in the asset mix. ... Additional deposits or partial withdrawals of collateral are made, in principle, on a daily basis, as determined by movements in the position. Derivatives are mainly used to hedge currency and interest rate risks."22
It can therefore be assumed that ABP uses mechanisms similar to the "liability-driven investment" practised in Great Britain.23 However, this is contrasted by the broad diversification in the bond portfolio, the low bond ratio of just under 40 percent and the high coverage ratio of liabilities at ABP of almost 120 percent.
In total, the claims of private households on insurance, old-age provision and standard guarantee schemes amounted to 2,574 billion euros in 2021, according to the financial accounts of the Deutsche Bundesbank. This was still a share of 33.8 percent of their total gross financial assets of 7,618 billion euros. 1,162 billion euros were accounted for by claims from life insurance reserves.
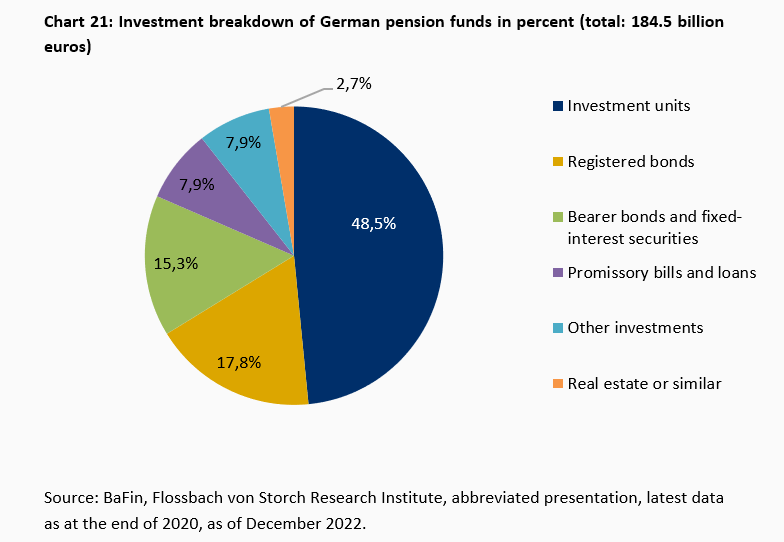
Claims from provisions in old-age security schemes, claims of old-age security schemes on the sponsors of old-age security schemes and on benefits other than old-age security benefits amounted to a good 979 billion euros in 2021. Pension funds manage just under one fifth of this. They have come under so much pressure because of the low interest rates that around 40 of them are under strict observation by the financial supervisory authority BaFin. Around 41 percent of their investments are directly interest-bearing (Chart 21).
Despite problems, however, it is unlikely that pressure on the markets could come from this side. Swap transactions for bonds similar to those in Great Britain are not known. In addition, in case of doubt, claims of beneficiaries can be reduced or the companies behind the funds can be called in. And at the end of the day, there is still the Pension Protection Association, which could at least absorb smaller funds.
Private equity investors seem to have been largely spared the slide in the prices of publicly traded companies in 2022. While the private market index of the investment consulting firm Lincoln gained 3.2 percent in the first three quarters, the S&P 500 EV, i.e., as an index measured in corporate values excluding financial companies, lost a good 22 percent.24 Should non-publicly traded companies have withstood inflation, rising interest rates and supply chain problems better? That may be true for individual companies, just as there were also crisis winners among publicly traded companies. But in the breadth of an index, it is first of all astonishing.
We suspect there is another reason behind this. While shares of companies from the S&P 500 are traded daily in large numbers and the share price thus reflects the expectations of market participants in a timely manner, the valuation of private equity is often based on individual models with their own assumptions on interest rates and projections of future cash flows.25 We therefore suspect that the earnings in the private equity sector are artificially smoothed by the valuation methods applied and that hidden burdens exist. The extent of this seems limited, however, if one takes the devaluations of the S&P 500 as a benchmark and considers that more long-term (and wealthy) investors are invested in this investment category with a market volume of around five trillion dollars.26
In a letter to the G20 heads of state, the chairman of the Financial Stability Board (FSB) points out possible risks from the area of so-called non-banking financial institutions, such as insurers or clearing houses. The term shadow banks is also used colloquially for this. In 2020, these held a total of 227 trillion dollars in financial assets (including derivatives and cash), which corresponds to 48 percent of all financial assets held worldwide. This means that they exceed the assets of banks and central banks combined.27
The FSB 2023 would like to pay special attention to the detection of "hidden leverage", i.e., transactions with debt capital that are not shown on the balance sheets of market participants. In addition, the FSB is looking at potential liquidity squeezes of investment funds. It cites a mismatch between fund pay-out modalities and the short-term liquid ability of assets as a problem in times of high volatility.28
A first example of such initially abstract distortions can currently be seen in American real estate funds. We will outline this in more detail in the next section:
In addition to the classic private equity market, which is characterised by purchases of unlisted and listed companies or parts of companies, there are other private investments: for example, in unlisted debt instruments (private debt), real estate and infrastructure. There is another 2.6 trillion dollars of investment capital in them. And unlike classic private equity funds, these instruments allow limited sales of shares.
The world's largest investor in commercial real estate by its own account, a well-known US private equity firm, manages a real estate portfolio of over 565 billion dollars for its investors alone. This includes a 70-billion-dollar real estate investment trust (REITs) for reasonably wealthy ordinary investors, which invests in student flats and casinos, among other things.
Should difficulties arise here, this could trigger a cascade. This is because the investments are partly debt-financed. It is possible to guess how much. According to data from last year, the current value of the properties is offset by 37 percent of the invested capital. This indicates a debt financing of a good 60 percent. This would be normal for the industry across all private equity classes and could even be described as conservative for real estate. However, if the tenants can no longer afford their instalments and the refinancing becomes more expensive for the private equity investor, the portfolios will come under pressure, especially since the investors could withdraw at least some of their money.
And this is already happening: one investment company has just restricted the redemption of fund units after quarterly redemption limits were exceeded. So, is pressure building up here because such developments are also likely to be registered by the lenders of the properties?
Through corresponding (leveraged) loans, they may be in the same boat. This shows the problem that a lot of business has been transferred from the banks to the shadow banks. In the realm of shadow banks, no investment company is "too big to fail", but this time there may be "too many to fail".
So, the US housing market could once again be a catalyst for a crisis. Private capital from wealthy individual investors could absorb losses but leveraged loans could once again become systemic.
The collapse of the so-called family office Archegos Capital Management shows how quickly even individual cases can cause problems worldwide. In spring 2021, losses on leveraged equity positions triggered double-digit billion dollar losses and the collapse of Archegos, which involved hedge funds and well-known banks, among others. The banking sector alone had to bear write-downs of over ten billion dollars - yet Archegos was a comparatively small fish.
The FSB's concerns raised about the lack of regulation in the shadow banking sector seem plausible, especially in light of the examples given. Due to the sheer size of the market, the risk would have to be mapped. However, the examples further support the need. We opt for a classification in the uncertain category, as the historical comparison is difficult due to the novelty of the development.
Our map of risks outlines the "known unknowns" ("known unknowns"). We have tried to identify higher and lower risks in this category. But the uncertainty remains - in the words of US economist Frank Knight - "radical". The reason for this is the so-called "unknown unknowns", which only become "knowns" ex-post.
Overall, a picture emerges that should make all players think. The proverbial "turn of the times", also in terms of interest rates, is likely to expose many weak points in the financial sector with more or less major consequences. Investors should therefore keep financial buffers in reserve for unforeseen impacts. Unfortunately, politics follows a different logic of action. Since it is incapable of financial precaution, one must expect that it will plug unexpectedly occurring financial gaps with new money creation. Although one cannot rule out a deflationary effect, we consider a further kindling of inflation more likely in the event of new financial crises.
1https://www.esma.europa.eu/sites/default/files/library/2015/11/2012-482.pdf
2https://www.ft.com/content/b53f2254-9409-432a-9755-62c621e3f552
3https://www.ecb.europa.eu/press/pr/date/2022/html/ecb.pr220721~973e6e7273.en.html
4https://papers.ssrn.com/sol3/papers.cfm?abstract_id=3823293
5https://www.ecb.europa.eu/mopo/implement/app/lending/html/index.en.html
6https://www.ft.com/content/9f4dadb1-c538-4c50-802b-55c5a22e098e
7https://www.ft.com/content/fe34de37-9389-4672-81a3-738cc044d4a6
8https://www.flossbachvonstorch-researchinstitute.com/de/fvs-vermoegenspreisindex-deutschland/
9https://www.fhfa.gov/DataTools/Downloads/Pages/House-Price-Index-Datasets.aspx
10https://www.nytimes.com/2022/09/28/opinion/housing-prices-pandemic.html
11https://fred.stlouisfed.org/release/tables?rid=52&eid=1192326&od=2007-01-01
13https://hypo.org/app/uploads/sites/2/2022/09/HYPOSTAT-2022-FOR-DISTRIBUTION.pdf
17https://www.imf.org/en/Blogs/Articles/2018/11/15/sounding-the-alarm-on-leveraged-lending
19https://www.abp.nl/english/financial-situation/annual-report
20https://www.abp.nl/images/top-100-investments.pdf
21https://www.ons.gov.uk/peoplepopulationandcommunity/personalandhouseholdfinances/incomeandwealth/bulletins/pensionwealthingreatbritain/april2018tomarch2020 and https://www.pfzw.nl/content/dam/pfzw/web/about-us/Annual%20report%20PFZW%202021.pdf
22www.abp.nl/english/financial-situation/annual-report, page 153


04.08.2022 - Macroeconomics
by Thomas Mayer
Legal notice
The information contained and opinions expressed in this document reflect the views of the author at the time of publication and are subject to change without prior notice. Forward-looking statements reflect the judgement and future expectations of the author. The opinions and expectations found in this document may differ from estimations found in other documents of Flossbach von Storch SE. The above information is provided for informational purposes only and without any obligation, whether contractual or otherwise. This document does not constitute an offer to sell, purchase or subscribe to securities or other assets. The information and estimates contained herein do not constitute investment advice or any other form of recommendation. All information has been compiled with care. However, no guarantee is given as to the accuracy and completeness of information and no liability is accepted. Past performance is not a reliable indicator of future performance. All authorial rights and other rights, titles and claims (including copyrights, brands, patents, intellectual property rights and other rights) to, for and from all the information in this publication are subject, without restriction, to the applicable provisions and property rights of the registered owners. You do not acquire any rights to the contents. Copyright for contents created and published by Flossbach von Storch SE remains solely with Flossbach von Storch SE. Such content may not be reproduced or used in full or in part without the written approval of Flossbach von Storch SE.
Reprinting or making the content publicly available – in particular by including it in third-party websites – together with reproduction on data storage devices of any kind requires the prior written consent of Flossbach von Storch SE.
© 2024 Flossbach von Storch. All rights reserved.