28.11.2022 - Studies

The marriage of green dreams and capital was never more pompous than shortly before the turn of the millennium, and in Germany of all places. At that time, Frank Asbeck took his Bonn-based company Solarworld public. The share price multiplied to a stock market value of over five billion euros.
Asbeck was not just any of those rather undescribed young leaders within the so-called New Economy wave of the time, but already well-known because deeply interwoven with the revival myth of the Green Party. In December 1979, together with Petra Kelly, Gert Bastian and Michael Vesper, among others, he was one of the founding members of the regional association in Hersel near Bonn - one of the first nationwide.
He went down in stock market history as the "Sun King" residing in a castle near Remagen on the Rhine, which he had bought from a certain Thomas Gottschalk. Solarworld had long been history by then, a stock market shell with a few million in market value remained.
Moving forward with solar dumping
Mistakes in subsidies and cheap offers from the Far East led to the Asian solar industry overrunning Germany. If the initial lavish subsidies for solar in Germany had not been reduced too significantly and dumping from Asia had been averted, who knows whether Solarwold would not still be at the forefront of the stock market today and almost naturally also in the area of ESG (Environment, Social, Governance).
Asian companies are now playing first fiddle there. For example, India's Adani Green Energy, with $44 billion in market capitalization, is in the top group of the global S&P Clean Energy index. Like Solarworld, Adani Green Energy is also a high-flyer on the stock market. Since its IPO in 2018, its share price has increased around seventy-fold in the local currency, the rupee.
Intuitively, this is not surprising: ESG products bring better margins to the financial industry and the "ESG taxonomy" set up by the EU Commission is driving small and large investors into green investments - or into those that sell themselves as green. This should drive prices.
But what holds true in individual cases does not hold up particularly well across the board. The global S&P Clean Energy Index, for example, performs very poorly compared to the S&P Oil & Gas Exploration & Production Select Industry Index (Chart 1).
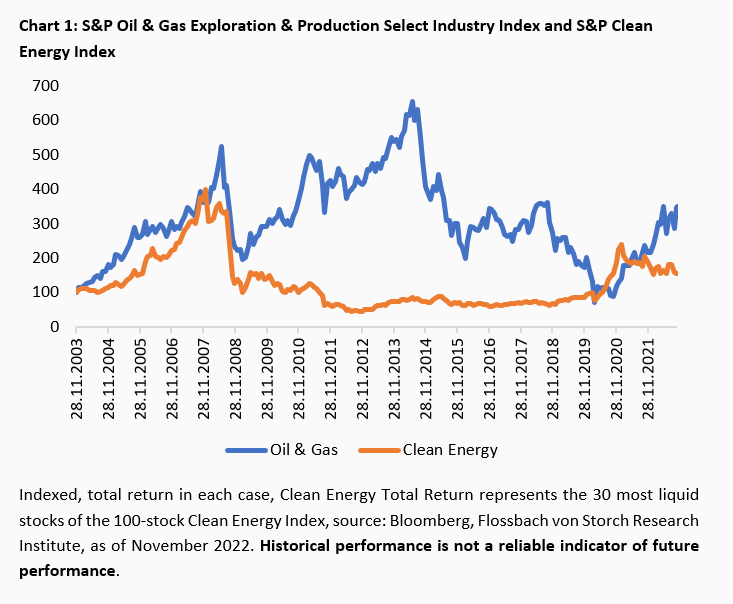
Black therefore beats green on the stock market by a factor of 4.5 over the period under consideration. This is surprising. Only after the Corona crash did those securities that are assigned to the cleaner energy sector by the index provider S&P (Standard & Poor's) perform better at times.
But why is this lagging behind, even though supposedly climate-friendly shares have long been in vogue?
For a fair analysis, companies should first be sorted out from the two indices that are of little relevance to large investors determining the market due to their small market capitalisation. The average for this is ten billion dollars.
After this, 25 members of the original 100 remain from the S&P Clean Energy Index as a whole. These include the Danish Vestas Wind Systems and the American Enphase Energy, a solar inverter and storage specialist. With a market capitalisation of 600 billion dollars, these 25 companies still represent two-thirds of the weight of all index members.
From the S&P Oil & Gas Exploration & Production Select Industry Index, 21 out of 59 companies with a stock market weight of 1640 billion dollars still account for about 92 percent of the market value of all companies in the overall index. Among this elite are the oil giants ConocoPhillips and ExxonMobil.
Together, the selected companies from both indices currently represent around 2.8 per cent of the global market capitalisation of all listed shares - and are thus roughly as heavy as all German shares together measured against the German CDax, which comprises just under 400 stocks.
Under discussion is why shares from the "clean world" (clean energy), which should have been able to access capital very easily in recent years thanks to favourable political and regulatory conditions, do not outperform the more disdained "dirty finches" (oil & gas) in terms of performance.
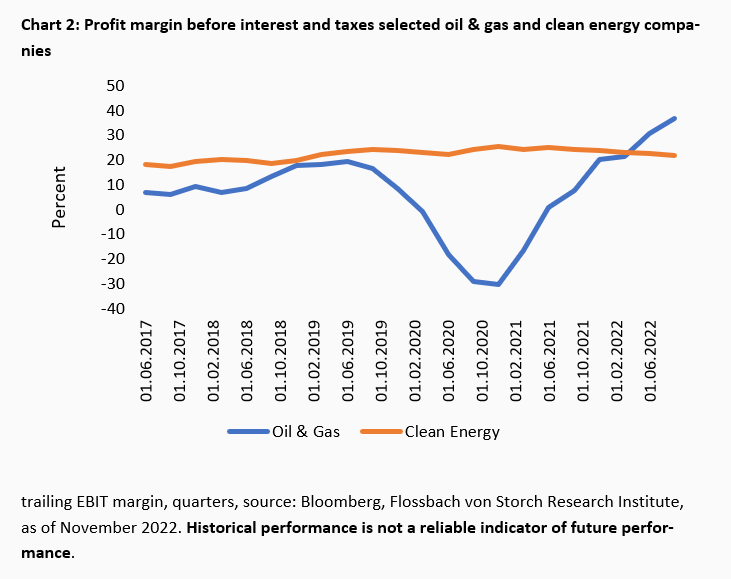
Usually, investors first look at the profits of companies for an initial assessment of shares. For example, the margin before interest and taxes (EBIT) provides information on how much profit from the sale and operation of wind turbines, solar plants, gas production or the sale of oil remains, proportionate to turnover and after devaluations on the balance sheet assets (EBIT margin).
And here, the clean energy companies show relatively stable margins between around 17 and 25 percent, measured on a quarterly basis. In contrast, the margins of the oil and gas groups fluctuate more strongly and were below those of the clean energy companies until the summer of this year (Chart 2).
Looking at the EBIT margin alone, there is no reason why Clean Energy should not have performed better. However, it is still two steps from EBIT to net profit as the starting point for cash flow: The financial result, the balance of interest expenses and income, and taxes are still to be deducted. High debt could therefore be an indication of interest expenses that depress earnings and cash inflows.
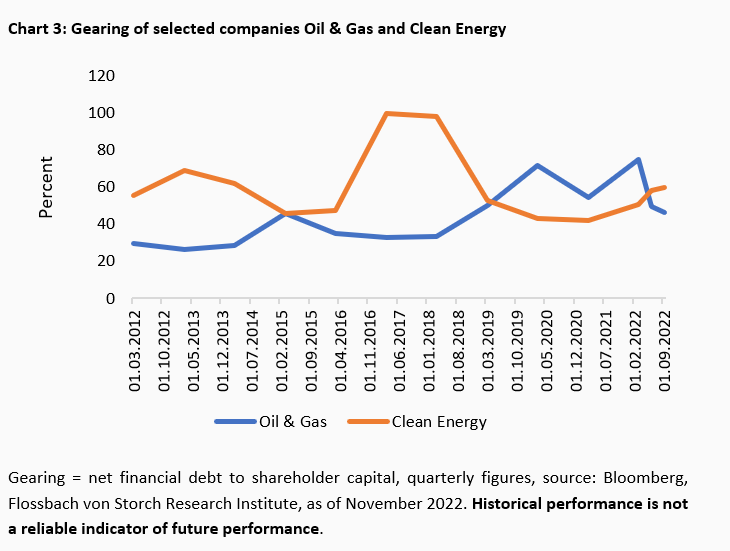
An important parameter in this context, which also provides indications of balance sheet stability, is the so-called gearing: the ratio of net financial debt to shareholder capital, which therefore regularly represents equity in full or at least to the very greatest extent.
However, this important indicator can only be used to say that the selected companies from both sectors are on track here with balance-sheet sustainable debt, which most recently stood at just under 47 (oil & gas) and just under 60 percent of shareholder capital (Chart 3).
This also does not explain Clean Energy's weaker performance.
However, if you put the gross debts to be serviced in relation to the revenues, you will find a first clue. Here, clean energy companies generally have a high ratio compared to oil and gas companies, and the ratio is rising (Chart 4).
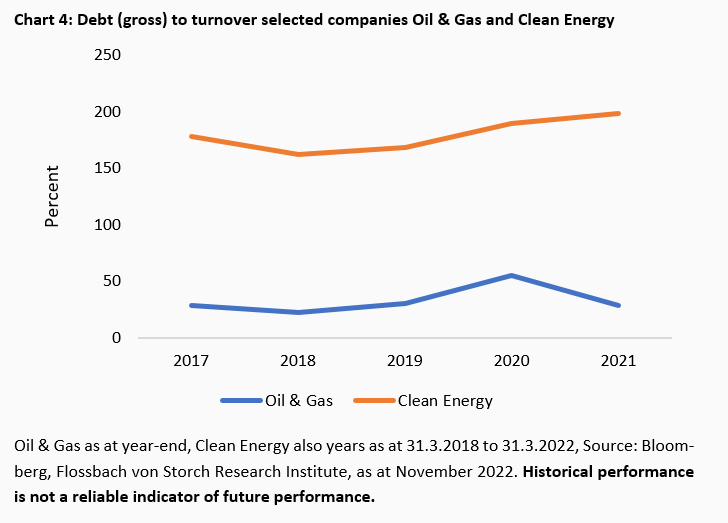
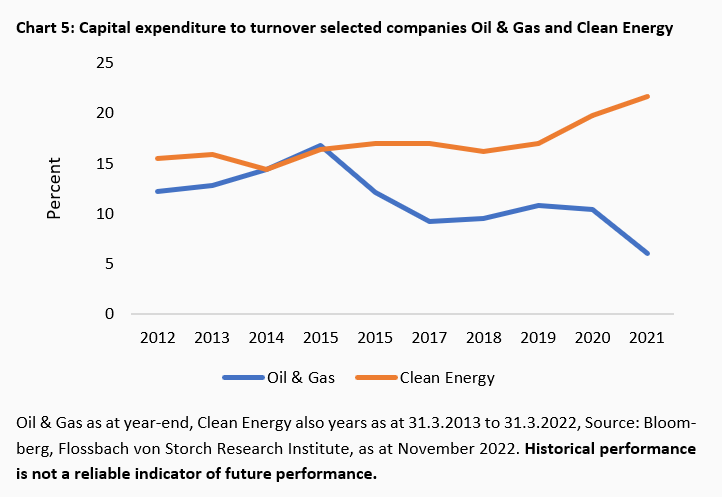
This suggests that clean energy companies have high borrowing requirements to finance their business. And this is also shown by the investment activity (Capital Expenditure, CAPEX for short) compared to turnover. While oil and gas companies have been operating with very small budgets for years, the CAPEX ratio for clean energy is rising from high levels (Chart 5).
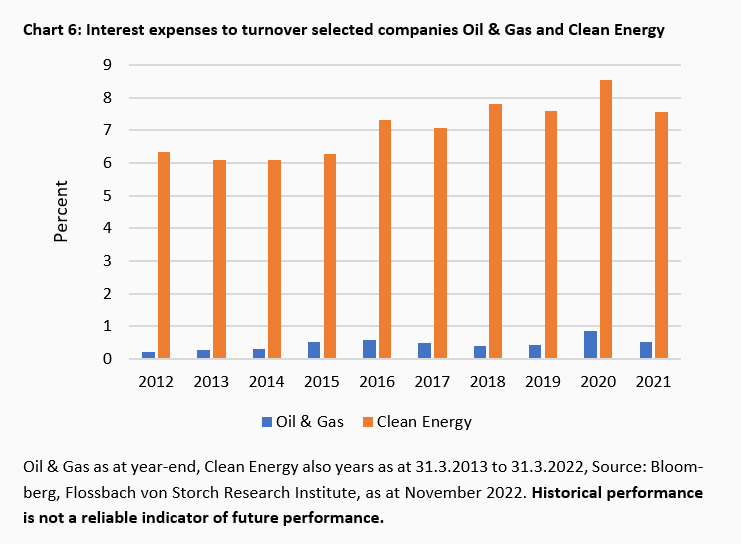
High debts and high financing needs also burden the interest balance in the income statements. In recent years, at least one out of every six to more than one out of every eight euros earned by clean energy companies was spent on interest - despite falling interest rates. In the supposedly capital-intensive oil and gas companies, on the other hand, interest expenses play only a subordinate role in relation to turnover (Chart 6).
The different interest expenses have an influence on the cash inflows. In the case of oil and gas companies, the recent improvement in business is also reflected in a jump in the return on free cash flow (Chart 7).
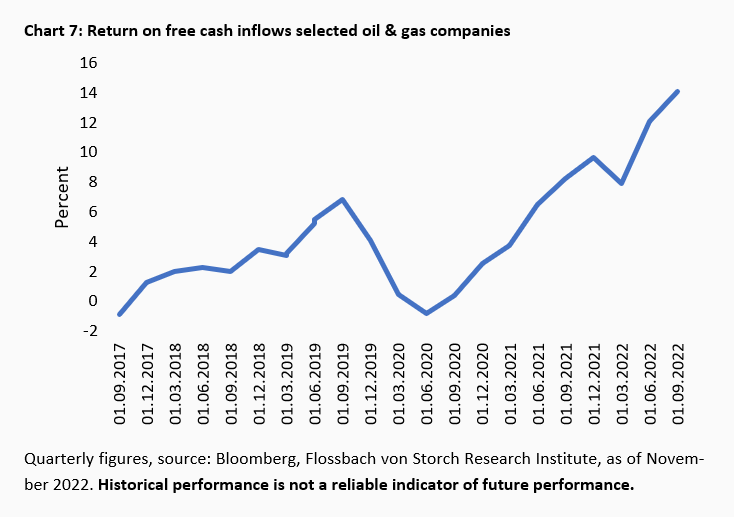
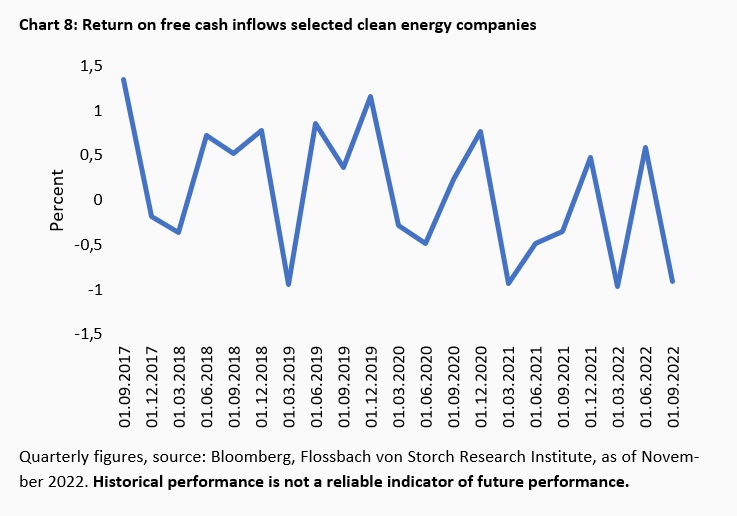
When it comes to this key indicator for the stock exchanges, the classic energy companies perform significantly betSter than the corporations with the clean energy business model. Over the past 21 quarters, the free cash flow yield averaged four percent - despite the Corona slump in demand for fossil energy. Clean energy companies, on the other hand, only managed a return of exactly 0.09 percent on average. Most recently, it was slightly negative (Chart 8).
Measured against this, Clean Energy has nothing left over for distributions or debt repayment.
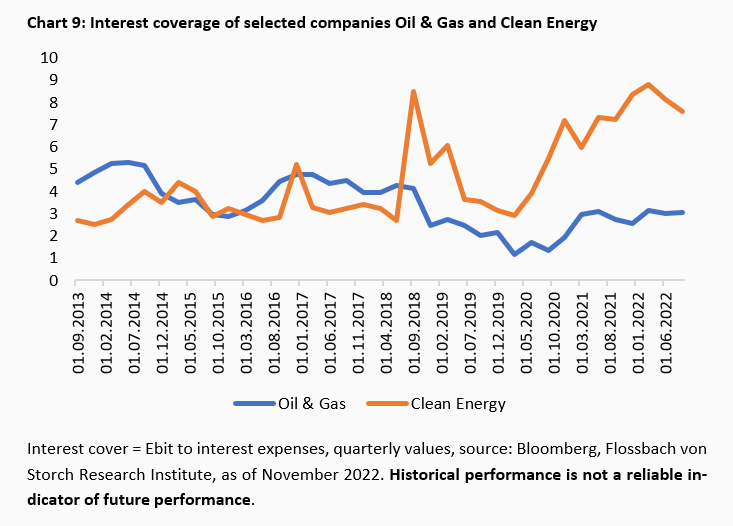
However, the relatively high debt and zero returns on free cash inflows did not threaten the existence of the company in an environment of low interest rates. This is shown by the interest coverage ratio (EBIT to interest expenses), which can be classified as comfortable with a factor of 9.1 most recently. Until recently, clean energy companies were even better off than oil and gas companies in terms of this factor, because the latter suffered much more from Corona in terms of earnings (Chart 9).
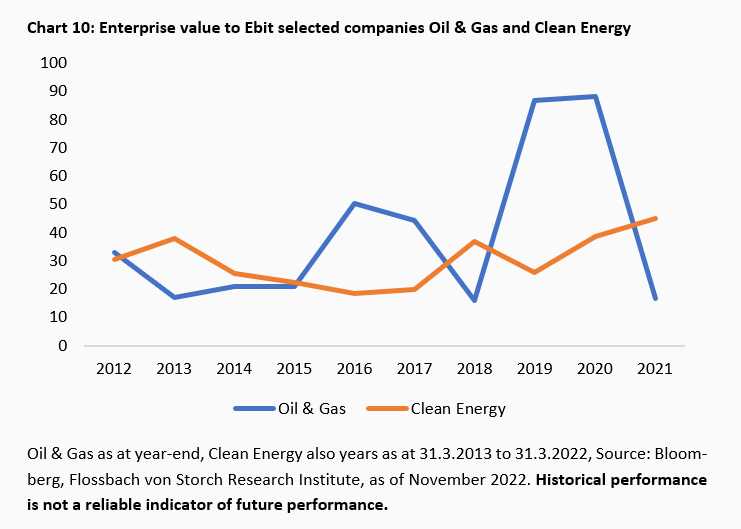
However, this has changed rapidly with the turnaround in interest rates. That is why oil and gas companies, measured by Ebit to enterprise value (stock market value plus/minus net financial debt/net financial liquidity), had fallen to favourable factors after the Corona collapse, while clean energy groups, viewed over ten years, were more expensive than ever (Chart 10).
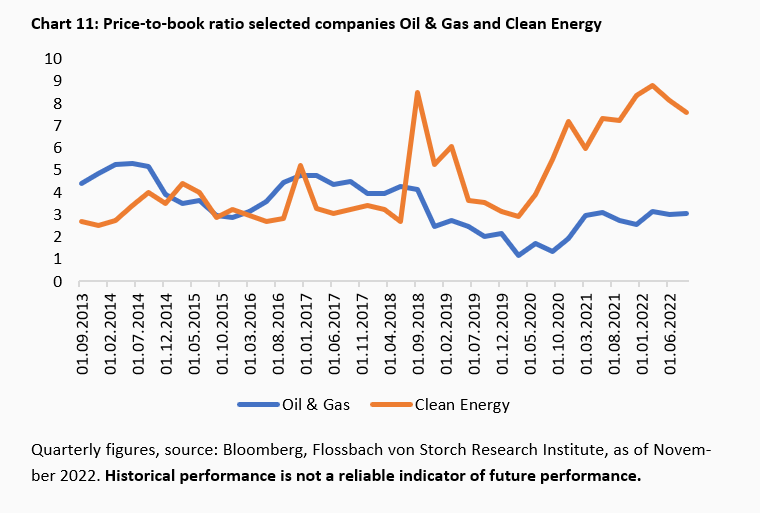
And despite the strong price gains this year, the price-to-book ratio (P/B ratio) of the selected oil and gas companies can still be described as moderate with a factor of around 3.0 most recently. In contrast, the price-to-book ratio of the selected clean energy companies remains high, i.e. tends to be "expensive", at 7.6 (Chart 11).
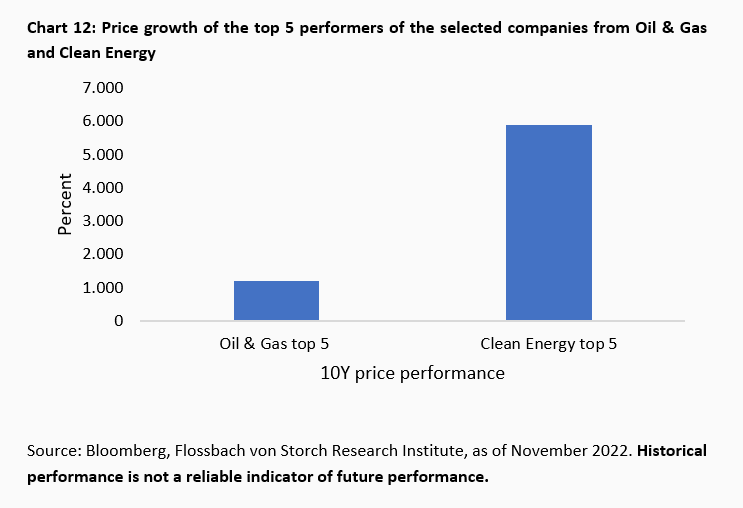
But the index, or a broad selection on it in terms of market value, is one thing. If you had guessed ten years ago which of the companies selected from the two indices would perform best, you would have been pleased with the enormous price growth of the "top 5" clean energy shares in particular (Chart 12).
The extent to which these top 5 will be able to repeat such gains in the future requires individual analysis. In the short term and at first glance, however, the valuation of these clean energy companies is clearly higher than that of the top 5 oil and gas companies, measured by key figures such as the estimated price/cash flow, price/earnings or enterprise value/Ebit ratio for 2023 (Chart 13).
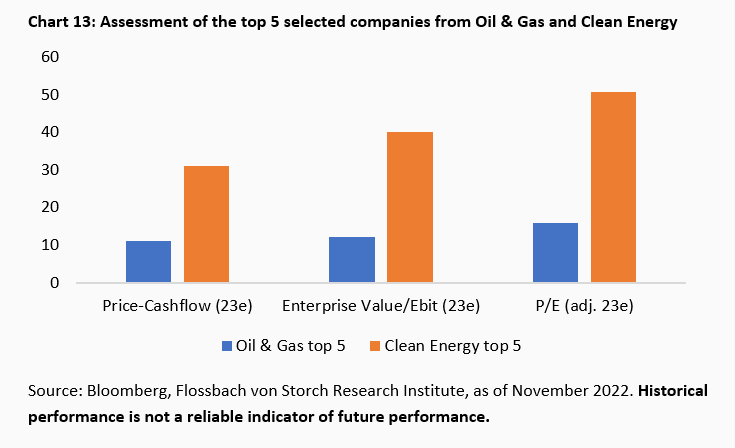
With a price-earnings ratio of over 50, the five topperformers from the clean energy sector are also worth around three times what investors are currently paying for the broad market as measured by the S&P 500.
The fact that investors have been pushed into investments that comply with the ESG taxonomy in recent years is reflected in the very high valuations awarded to companies from the clean energy sector.
High investment activity of these companies, high debts relative to business volume and high interest expenses put free cash inflows under pressure, so that ultimately the traditional oil and gas companies with their more favourable ratios are nevertheless preferred on balance and across the board, as can be seen from their better performance on the stock market.
As long as the valuation advantage of the energy classics does not diminish, it is unlikely that clean energy companies will perform better across the board. In any case, a broad investment there has proven to be less lucrative in the past. In view of the high level of debt, albeit far from threatening the existence of clean energy companies, rising interest rates are more of a warning to be cautious.
Selectively, on the other hand, a good performance on the stock market is of course not impossible. This requires an analysis of the respective individual stocks.


Legal notice
The information contained and opinions expressed in this document reflect the views of the author at the time of publication and are subject to change without prior notice. Forward-looking statements reflect the judgement and future expectations of the author. The opinions and expectations found in this document may differ from estimations found in other documents of Flossbach von Storch AG. The above information is provided for informational purposes only and without any obligation, whether contractual or otherwise. This document does not constitute an offer to sell, purchase or subscribe to securities or other assets. The information and estimates contained herein do not constitute investment advice or any other form of recommendation. All information has been compiled with care. However, no guarantee is given as to the accuracy and completeness of information and no liability is accepted. Past performance is not a reliable indicator of future performance. All authorial rights and other rights, titles and claims (including copyrights, brands, patents, intellectual property rights and other rights) to, for and from all the information in this publication are subject, without restriction, to the applicable provisions and property rights of the registered owners. You do not acquire any rights to the contents. Copyright for contents created and published by Flossbach von Storch AG remains solely with Flossbach von Storch AG. Such content may not be reproduced or used in full or in part without the written approval of Flossbach von Storch AG.
Reprinting or making the content publicly available – in particular by including it in third-party websites – together with reproduction on data storage devices of any kind requires the prior written consent of Flossbach von Storch AG.
© 2024 Flossbach von Storch. All rights reserved.

Christof Schürmann
Senior Research Analyst
At the Institute since 2022. The graduate in business administration (FH), previously worked as a journalist and deputy head of "Money" at WirtschaftsWoche. The trained banker and book author ("Die Bilanztrickser") taught balance sheet research part-time at the private university BiTS in Iserlohn.
All articles by Christof Schürmann