11.10.2019 - Studies
Economic activity in Germany has been weak since the beginning of 2019. Several leading indicators point to a looming recession. However, so far there has been no unambiguous and methodologically sound single tool to track the business cycle in Germany. This note introduces the FvS Business Cycle Indicator to fill the gap.
Developments of the FvS BCI so far this year suggest that recession could have started in April 2019. But a final judgement based on our methodology will have to wait until we have seen the recession trough.
Economic activity in Germany has been weak since the beginning of 2019. Several leading indicators point to a looming recession. But how is “recession” defined? So far, the definition is based only on a rule of thumb, because an unambiguous and methodologically sound single tool to track the business cycle in Germany is missing. This note introduces the FvS Business Cycle Indicator (FvS BCI) to fill the gap.
Our indicator has two advantages for the assessment of the business cycle: First, by assessing GDP data against the information obtained from other activity data it can more reliably identify business cycles peaks and troughs. Second, as it is based on monthly data it can more precisely time turning points of the business cycle.
Developments of the FvS BCI so far this year suggest that recession could have started in April 2019. But a final judgement based on our methodology will have to wait until we have seen the recession trough.
Since 1979, the National Bureau of Economic Research (NBER) has documented and officially announced the turning points in the business cycle of the US economy.1 Based on a thorough analysis of macro indicators of real economic activity, the NBER retrospectively determines the dates of troughs as the starting date of the expansion, and the dates of peaks as the starting date of the recession.2 Specifically, according to the NBER definition:
“A recession is a significant decline in economic activity spread across the economy, lasting more than a few months, normally visible in production, employment, real income, and other indicators. A recession begins when the economy reaches a peak of activity and ends when the economy reaches its trough. Between trough and peak, the economy is in an expansion.”3
A similar procedure does not exist for Germany or other developed economies.4 The customarily followed approach is to look at the development of quarter-over-quarter growth rates of real GDP. If at least two consecutive quarters of contraction occur, the economy is said to experience a “technical recession”.5
However, this definition has at least two drawbacks. First, by focusing on a two-quarter period, it disregards the momentum of the economy.6 Second, GDP data are only available on a quarterly basis, with the flash estimates often subject to subsequent revisions. This implies serious time lags for business cycle monitoring.
This paper introduces the FvS Business Cycle Indicator for Germany, which offers a reliable and timely measure of business cycle developments. Our methodology follows the spirit of the NBER’s approach. However, in contrast to the NBER, we place less emphasis on discretion and use a quantitative indicator to assess the evolution of the business cycle.
The NBER’s Business Cycle Committee decides on the turning points (trough and peak) in the US business cycle several quarters after the passing of the turning points. The committee waits until a sufficient number of data is available to avoid the need for major revisions. The idea is to infer from these data on real GDP (and real Gross Domestic Income, GDI), which the Committee regards as the best single measure of aggregate economic activity. By combining monthly data with GDP data, it is not only possible to better assess lasting turning points of GDP, but also to time these turning points more precisely.
For instance, in September 2010, based on real GDP and GDI, which reached their lows in the second quarter of 2009, the Committee concluded that the trough occurred in mid-2009. With the help of several monthly indicators (estimated monthly GDP, manufacturing and trade sales, industrial production, real personal income less transfers and labor market indicators), the Committee then was able to identify June as the month of the trough.
Following the NBER’s approach, we analyze a wide range of economic indicators to better capture the overall development of the German economy. However, we depart from their approach in two important respects. First, we look at a broader list of monthly indicators, including data covering only a part of the economy. Second, based on these monthly indicators, we use principal component analysis (PCA) to derive a single reliable indicator (which we dub FvS Business Cycle Indicator for Germany) to capture swings of the business cycle.7
We use 22 economic indicators, for which we have monthly observations, and which together cover the entire breadth of activity in the economy (Table 1). All series are calendar and seasonally adjusted. Since the PCA is scale sensitive, we index all time series to January 2019 = 100. The longest data series are available back to 1991, but some series are available only starting in 2008 (international trade data). For this reason, the operational version of our monthly FvS Business Cycle Indicator, which we will update on a regular basis, is available from January 2008. However, to validate our model prior to 2008 we compare the performance of the Indicator with quarterly real GDP back to 1991 (see next section).
Based on the results of the PCA, the first principal component is responsible for almost 74% of variation in our set of explanatory variables. Each of the remaining 21 principal components is negligible, since their individual contribution to the overall sample variation is under 1%. Thus, we construct our FvS Business Cycle Indicator based on the first principal component.
Since the squares of the estimated coefficients for a principal component add up to one, we use the squared coefficients of the first principal component to weigh the respective explanatory variables (see Appendix). Thus, the FvS Business Cycle Indicator is a weighted average of our monthly indicators, with the weights determined by PCA.
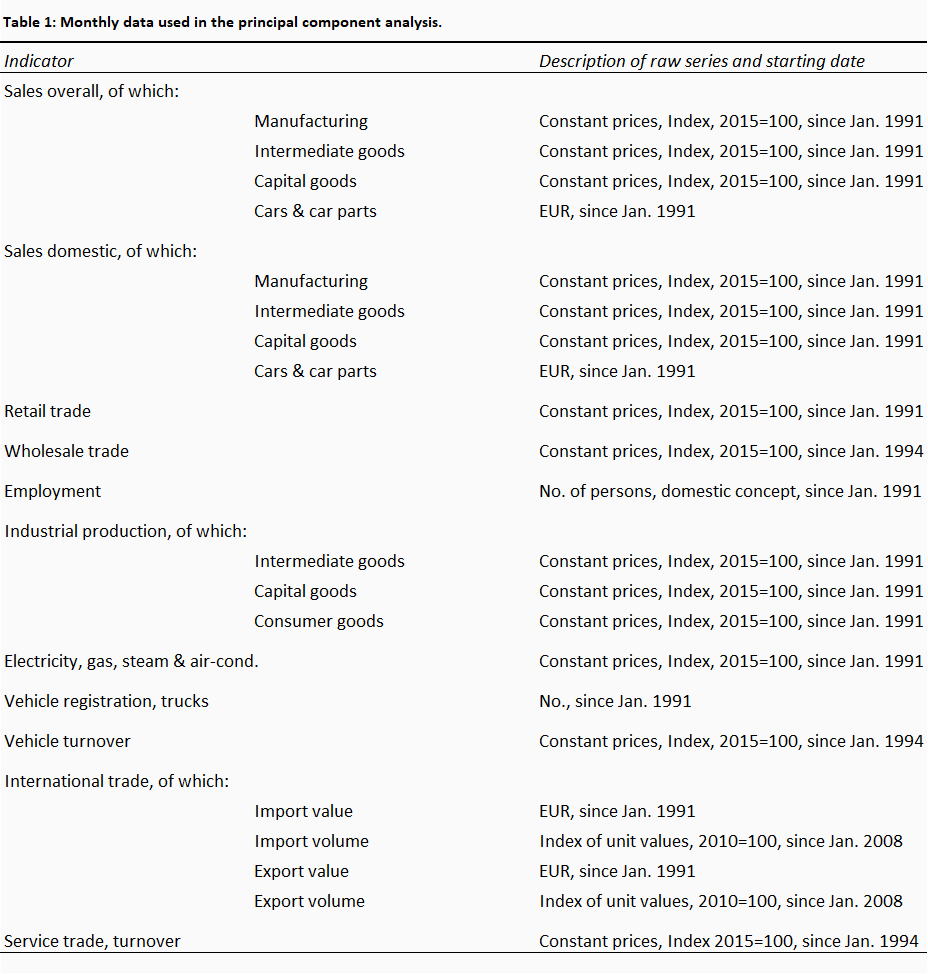
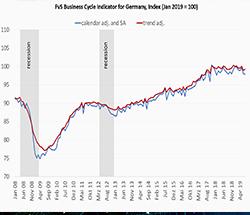
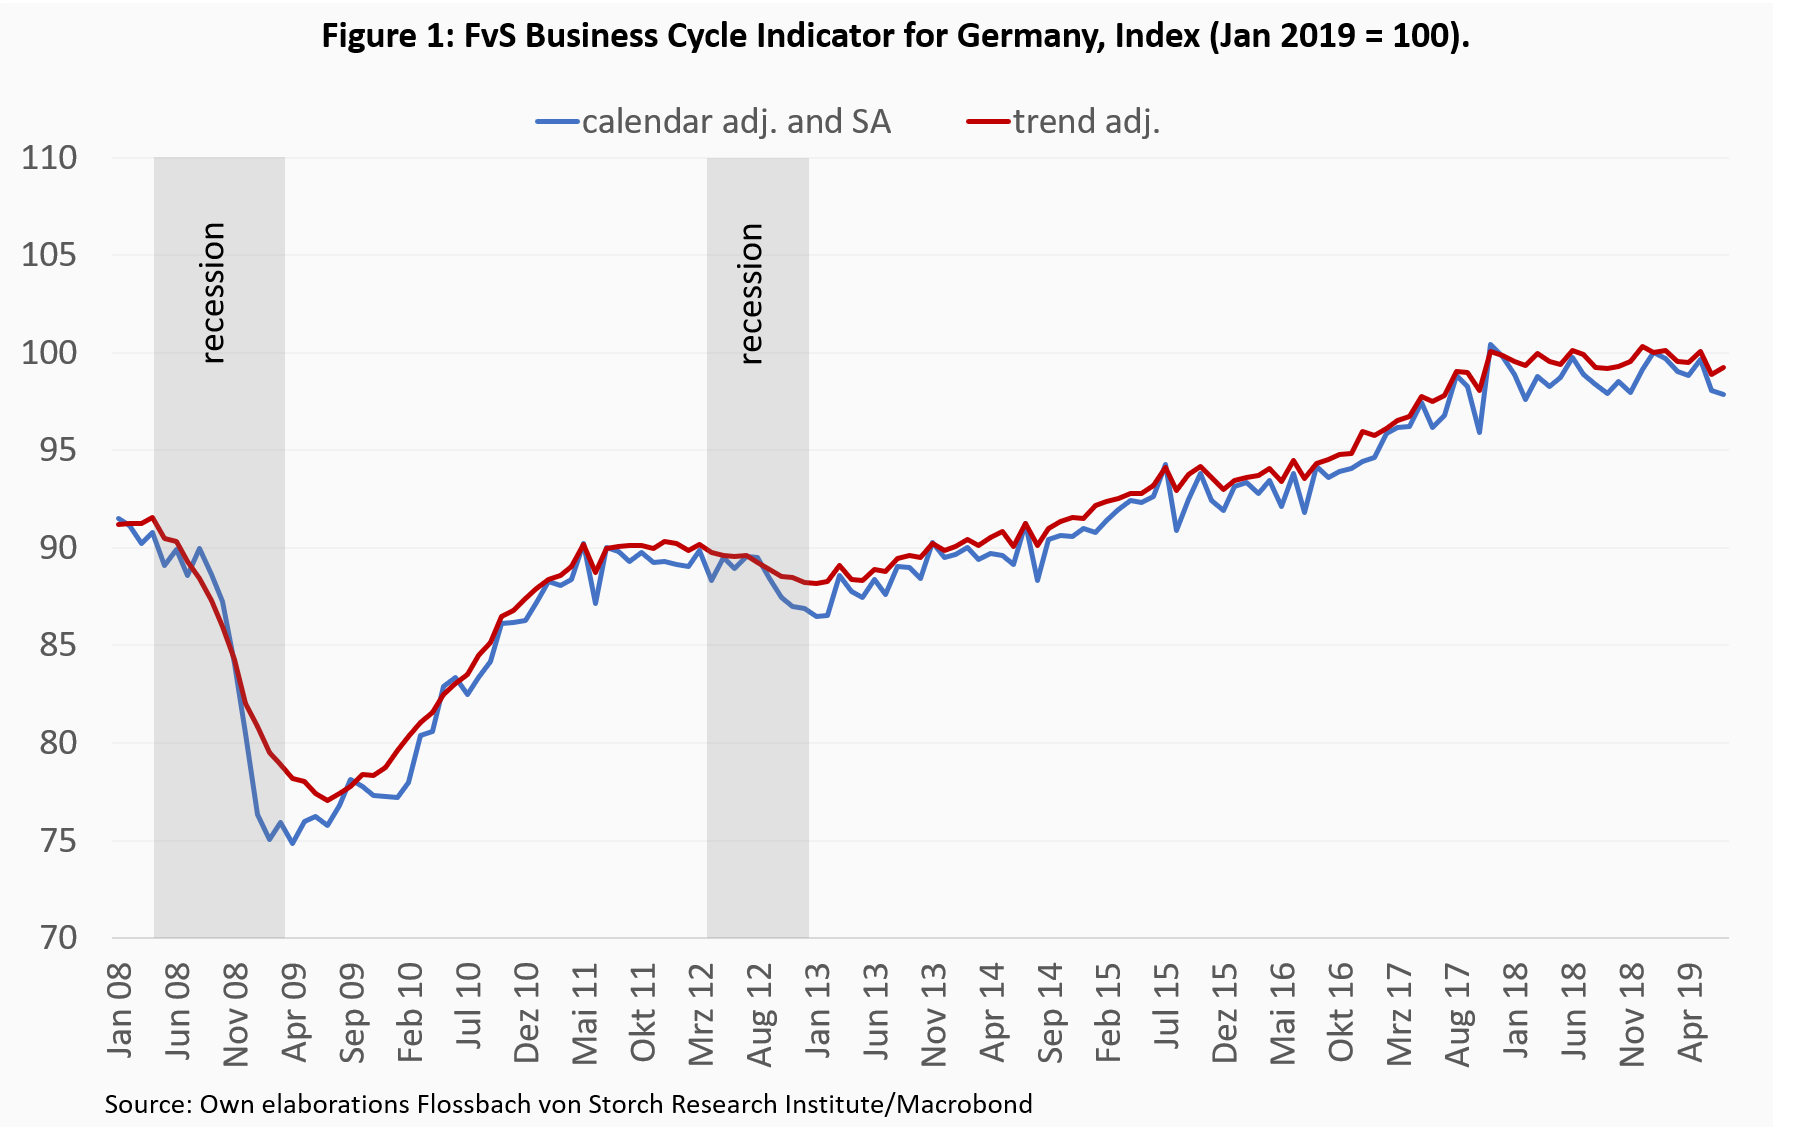
Figure 1 shows the monthly FvS Business Cycle Indicator as a calendar and seasonally adjusted series without and with trend adjustment. The Indicator has stagnated since the second quarter of 2018 and it has declined in five out of seven months so far during 2019. This development is much in line with the negative growth rate of real GDP in the second quarter of 2019. The FvS Business Cycle Indicator could have anticipated this.
Looking at the past development of the Indicator around the Great Financial Crisis, it emerges that it would have signaled in a timely way the subsequent recession in Germany. The series of the Indicator reached the peak in May 2008, which indicates the start of the recession. It then reached the trough in February 2009, which marks the end of the recession and the starting point of the next expansion.
Another visible, although rather mild economic recession occurred at the time of the European sovereign debt crisis in mid-2012. The Indicator reached the peak in April 2012 (beginning of the recession) and the trough in December 2012 (end of the recession).
A convincing validation of the Indicator requires that its long-term past performance mirrors the development of real GDP. This is especially important since real GDP is customarily the reference indicator for policy makers and practitioners to assess the business cycle dynamics and recessions.
However, given that real GDP is only available at a quarterly frequency and since we are unable – due to data limitations – to follow the methodology of Stock and Watson from the Business Cycle Dating Committee of the NBER to estimate monthly real GDP data, we tested the robustness of our Indicator based on quarterly data. In doing so, we re-estimated the Principal Component Analysis for the sample of indicators, measured on a quarterly basis and for which data is available since 1991.
From the PCA, we could confirm that the first principal component explains 75% of the sample variation. The second principal component adds 11,4% and the third one 6 %. Thus, cumulatively, the first three components are responsible for almost 93% of the sample variation.
Based on these results, we run a simple regression model of real GDP and the first (three) principal component(s). The results of the estimations in Table 2 show that the first principal component explains 91% of the variability in real GDP (R-squared adjusted in the first specification). Moreover, the addition of the second and third principal component improves further the goodness of fit of the regression by seven percentage points.
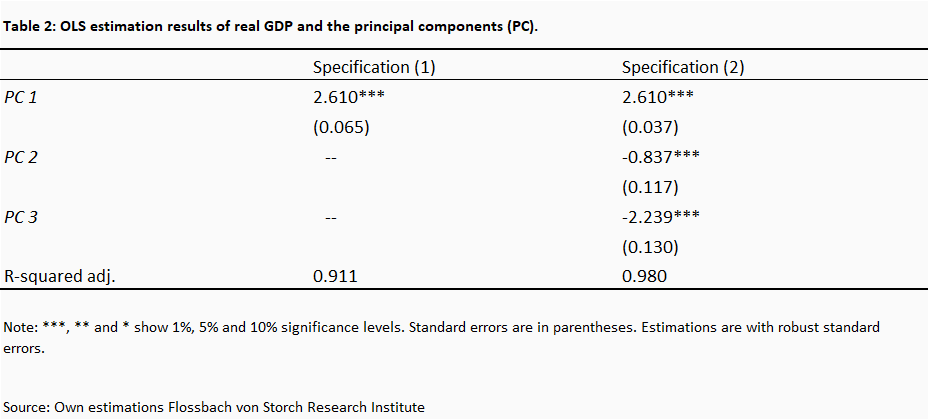
Figure 2 shows the quarterly times series of quarter-over-quarter growth rates of the FvS Business Cycles Indicator and of real GDP. Although the Indicator shows large swings at the extremes (both positive and negative), it tracks with sufficient precision real GDP growth.
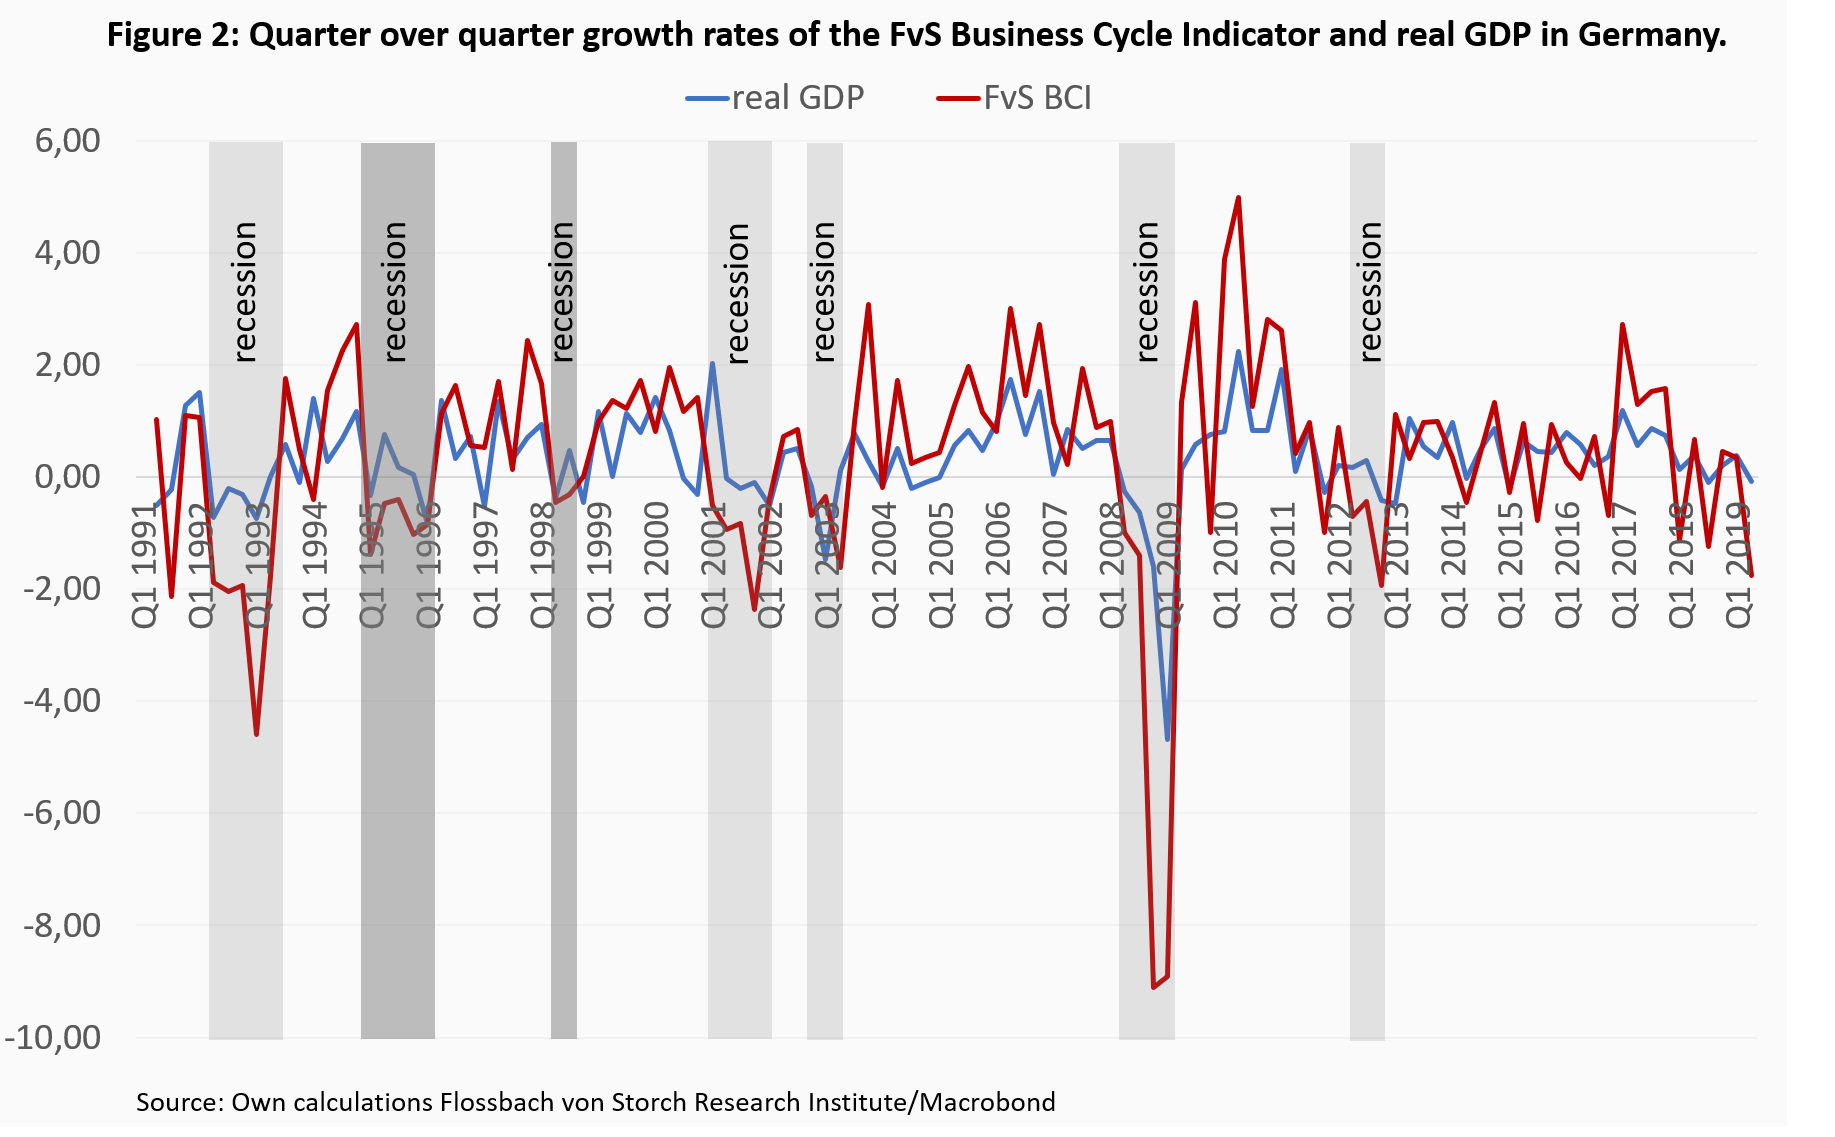
We find a general concordance between the technical recession definition based on real GDP and the recession determination based on our quarterly series of the FvS BCI, as shown by the shaded recession areas in Figure 2. There is a perfect overlapping between the two recession definitions for the recession 2008/2009. However, there are two non-negligible differences for the other recessions. First, there were two mild recessions (dark grey shadowed areas in Figure 2), which we could detect based on FvS BCI but which remained unobserved based on the technical definition, although in both cases there were separate quarters with negative growth rates of real GDP. Second, in the remaining five recessions – in the early 1990s, in 2001/2002, in 2003, and in 2012 – the FvS BCI points to a one- to two-quarter longer recession than the technical definition would suggest. Moreover, the FvS BCI could have anticipated the technical recession both in 2001/2002 and in 2012 by one to two quarters earlier.
As already discussed above, our operational version of the Indicator, which we will continue to update on a monthly basis, is available since 2008. To determine a historical record of recessions of the German economy since 1991 on a monthly basis, we calculate a monthly series for the FvS BCI for the period 1991-2007 based on estimates with the restricted set of data as explained in the previous section and splice this series with the series calculated with the full set of data as of 2008. Figure 3 shows the time series of the Indicator, with the structural break due to the enlarged set of series marked between December 2007 and January 2008.
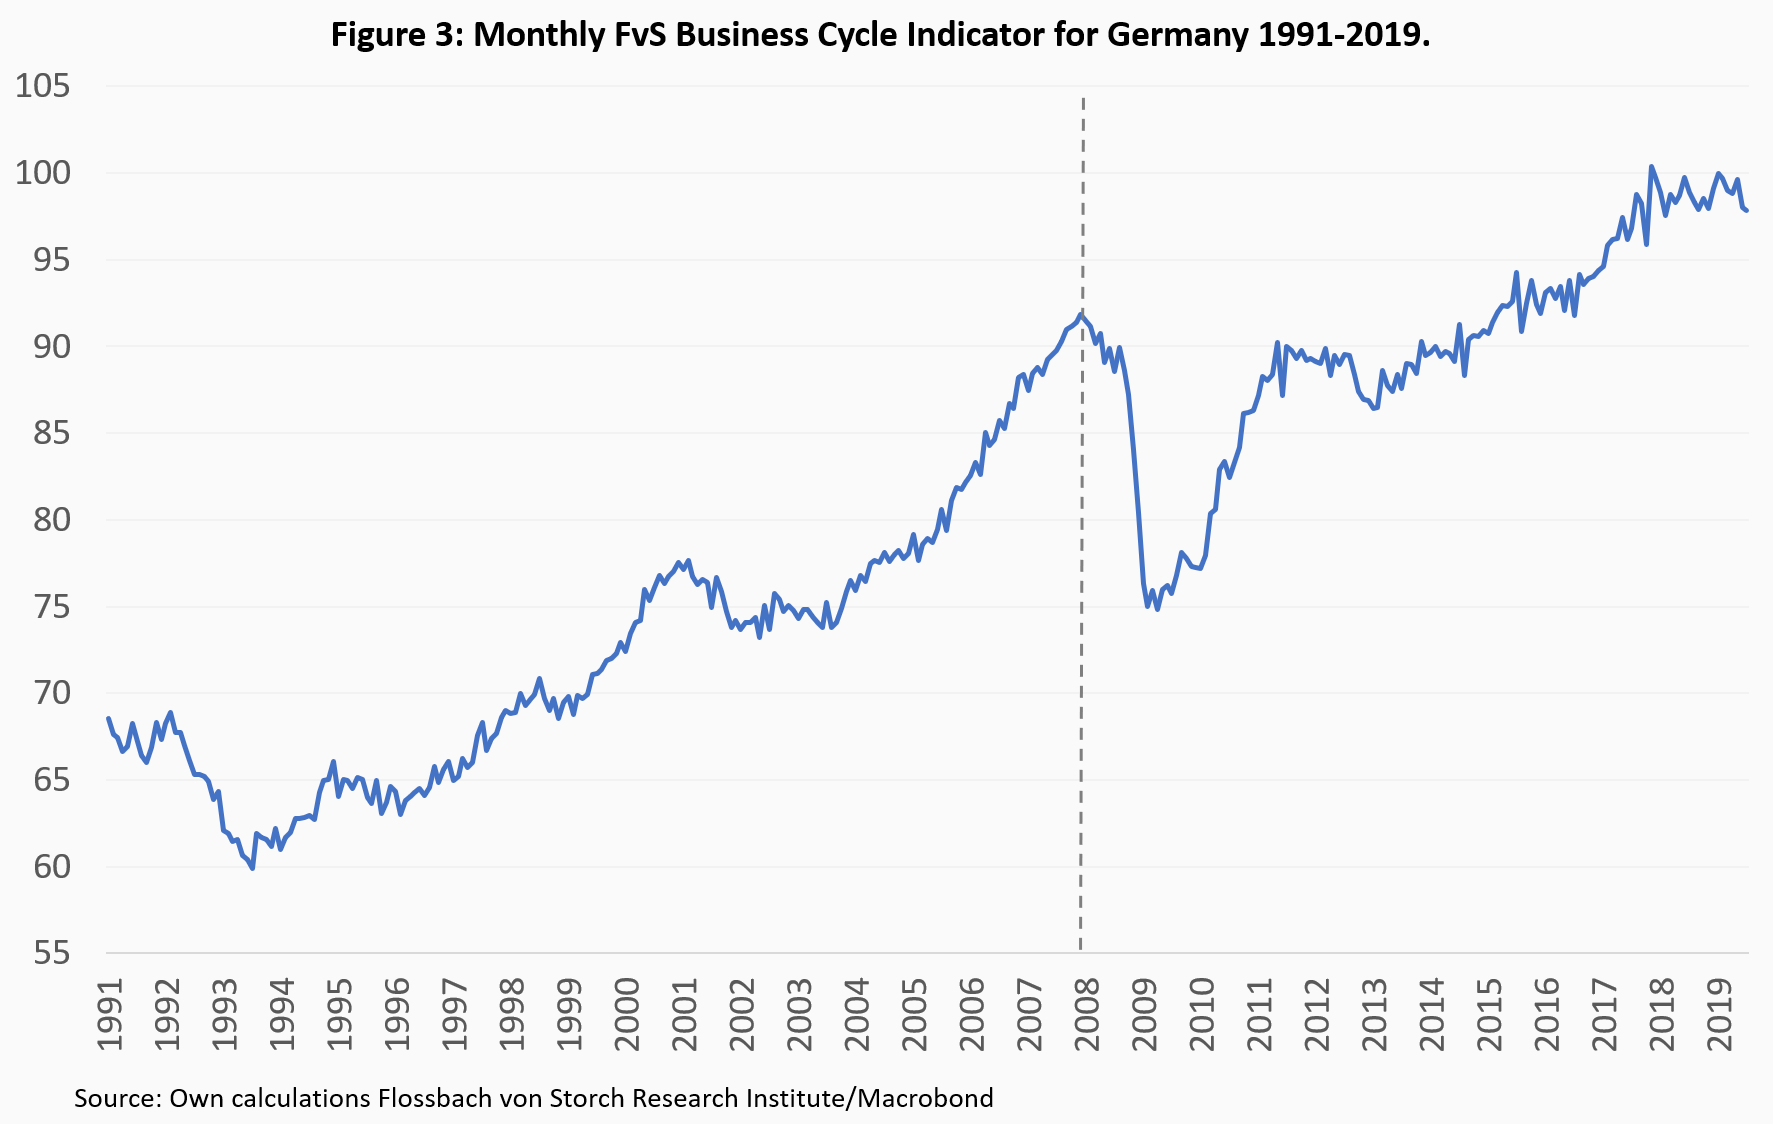
Based on the combined series, we determine the monthly dates of the turning points in the business cycle (see Table 3). A recession from peak to trough is identified when the FvS BCI shows a sustained decline followed by a sustained recovery. The exact dates of peaks and troughs are then determined based on the monthly observations of the Indicator.
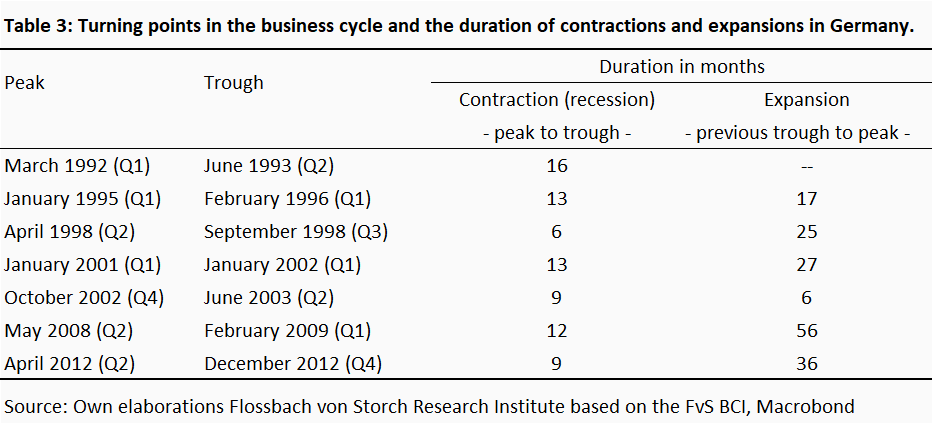
The monthly series of the FvS Business Cycle Indicator is a good proxy for the development of real GDP. Compared to the existing rule of thumb, our indicator has two advantages for the analysis of the business cycle: First, by assessing GDP data against the information obtained from other activity data it can more reliably identify business cycle peaks and troughs. Second, as it is based on monthly data it can more precisely time turning points of the business cycle. Developments of the FvS BCI so far this year suggest that recession could have started in April 2019. But a final judgement based on our methodology will have to wait until we have seen the recession trough.
The present weakness of the FvS BCI is mostly driven by domestic and foreign sales of goods (intermediate, consumption and capital goods) and industrial production - both categories have recorded negative growth rates since the beginning of the year. International trade (imports and exports) and employment have also weakened recently. Demand for vehicles (truck registrations and vehicle sales) and the sale of services are still providing some positive impulses.
Appendix: Principal Component Analysis (PCA)
PCA, and more generally, factor models are used in frameworks with a large number of closely related variables where multicollinearity is a risk. The aim is to reduce dimensionality of the system by identifying the most important influences from these variables.
Analytically, if there are n explanatory, closely related variables in the regression model, PCA transforms them into n uncorrelated new variables (principal components), of the form:

where xi, and pi (with i, j = 1, …, n) are the original explanatory variables and the newly estimated principal components, respectively, and αij are estimation coefficients (so called factor loadings) on the jth explanatory variable in the ith principal component. It is required that the sum of the squares of the coefficients for each component is one:

The principal components are derived in descending order of importance. Moreover, in the case of collinearity of the original variables, the first components will account for much of the variation, whereas some of the last principal components will account for little variation and can be disregarded. The stronger the correlation between the original variables, the higher is the explanatory power of the first principal component.
To validate the PCA, the so-called Kaiser-Mexer-Olkin’s (KMO) measure of sampling adequacy can be calculated. KMO takes values between 0 and 1, with relatively high values suggesting that variables have sufficient in common to warrant a PCA. Small KMO values suggest that the sample is insufficiently adequate to apply a PCA.
After the PCA, the regression to be estimated for the dependent variable y is:

Where βm (with m = 1, …, r) are the estimation coefficients and pmt are the first r (0 < r < n) principal components deemed sufficiently useful in explaining the variation of n original variables. The principal component estimates will be biased, but they are more efficient than the OLS estimators since redundant information is excluded.
1 Business cycle reference dates for the USA are computed back to 1857, but the official announcements started in 1979. For details, see www.nber.org/cycles.html.
2 For a detailed description of the NBER’s approach, see the press releases of the turning points in the business cycles, available at: www.nber.org/cycles.html.
3 “Determination of the December 2007 Peak in Economic Activity”, Business Cycle Dating Committee, National Bureau of Economic Research, December 1, 2008, available at www.nber.org/cycles/dec2008.html.
4 The German Council of Economic Experts (Sachverständigenrat zur Beurteilung der gesamtwirtschaftlichen Entwicklung) introduced in 2009 a recession criterium, according to which “a recession occurs when a decline in the relative output gap by at least two thirds of the respective potential growth rate is accompanied by a currently negative output gap.” [“Annual report of the German Council of Economic Experts for 2008/2009”, p. 7, available at: https://web.archive.org/web/20090306123725/http://www.sachverstaendigenrat-wirtschaft.de:80/download/gutachten/ga08_i.pdf]. However, it is not specified on which time period the criterion should be applied. Moreover, the concept of output gap is an unobservable concept, which must be estimated. The methodology underlying the estimations of the concept has been often criticized. See, for instance, Tooze, A. (2019), “Output gap nonsense”, Social Europe, available at: www.socialeurope.eu/output-gap-nonsense.
5 The origins of the term are unclear, but it is a widely accepted rule of thumb. In line with it, the UK’s economics & finance ministry (the Treasury) recognizes that “the commonly accepted definition of a recession in the UK is two or more consecutive quarters (a period of three months) of contraction in national GDP.”
6 To give an example, let’s compare two economies. The first experiences quarter-over-quarter growth rates of real GDP of -2% in the first quarter and of -4% in the third quarter, with zero growth in the other quarters of the year. The second faces negative growth of -0.1% in the second and third quarter and positive growth in the first and fourth quarter. According to the conventional definition, only the latter economy was in recession, although the former suffers a more serious overall contraction.
7 For methodological details concerning the PCA, see the Appendix.


Legal notice
The information contained and opinions expressed in this document reflect the views of the author at the time of publication and are subject to change without prior notice. Forward-looking statements reflect the judgement and future expectations of the author. The opinions and expectations found in this document may differ from estimations found in other documents of Flossbach von Storch SE. The above information is provided for informational purposes only and without any obligation, whether contractual or otherwise. This document does not constitute an offer to sell, purchase or subscribe to securities or other assets. The information and estimates contained herein do not constitute investment advice or any other form of recommendation. All information has been compiled with care. However, no guarantee is given as to the accuracy and completeness of information and no liability is accepted. Past performance is not a reliable indicator of future performance. All authorial rights and other rights, titles and claims (including copyrights, brands, patents, intellectual property rights and other rights) to, for and from all the information in this publication are subject, without restriction, to the applicable provisions and property rights of the registered owners. You do not acquire any rights to the contents. Copyright for contents created and published by Flossbach von Storch SE remains solely with Flossbach von Storch SE. Such content may not be reproduced or used in full or in part without the written approval of Flossbach von Storch SE.
Reprinting or making the content publicly available – in particular by including it in third-party websites – together with reproduction on data storage devices of any kind requires the prior written consent of Flossbach von Storch SE.
© 2024 Flossbach von Storch. All rights reserved.