28.10.2022 - Comments

"In the Federal Republic, after a rise in January, the price level was largely under the negative influence of continuing monetary restrictions, scarce liquidity, high capital market interest rates as well as socio-political and economic uncertainty into October". These are the words of Deutsche Bank in its annual report. The year is 1975 and the Frankfurt bank looks back on the previous year on the financial markets.
High inflation, the oil crisis and rising interest rates caused problems for the stock markets at that time. In the bear market of 1973/74, as a phase of significantly falling prices for shares or bonds is called, the American S&P 500 index slumped by almost half and sentiment was at rock bottom. The bear market almost half a century ago is described as a "slow, painful downward spiral" on the stock markets.
At that time, it was at best only possible to vaguely estimate when such a bear market, which regularly sets in at irregular intervals, would bottom out. This is still true today. However, investors have parameters at their disposal to assess whether an investment in shares makes sense despite increased uncertainty and falling prices - or whether, on the contrary, alternatives such as bonds should have a high weighting in the portfolio.
Certain parallels to the seventies of the 20th century cannot be denied these days. With Russia's war of aggression on Ukraine, parts of the world are in a severe energy crisis, as they were then, and inflation has risen to levels that in Germany have already surpassed the peaks of the price increases of the 1970s.
Today, as then, the central banks have also stepped from the accelerator to the brake pedal for the time being - comparatively mild monetary restrictions have contributed significantly to the bond market experiencing the biggest crash in its history this year and to the bear taking the reins on the stock markets since the spring as a synonym for falling prices.
While European equities and the Nasdaq index with its numerous mid-cap technology stocks entered a bear market - defined as a loss of more than 20 per cent from the index high - in late winter and May of this year, the S&P remained above this loss threshold, which marks the beginning of a bear market, until a good week before the summer solstice, when it slipped below it.
It was not until this October that the index, which currently has a market value of around 31,000 billion dollars, fell to its lowest point of the current downturn phase, with a loss of a good quarter by then. However, this is only slightly noticeable in a very long-term view (Figure 1).
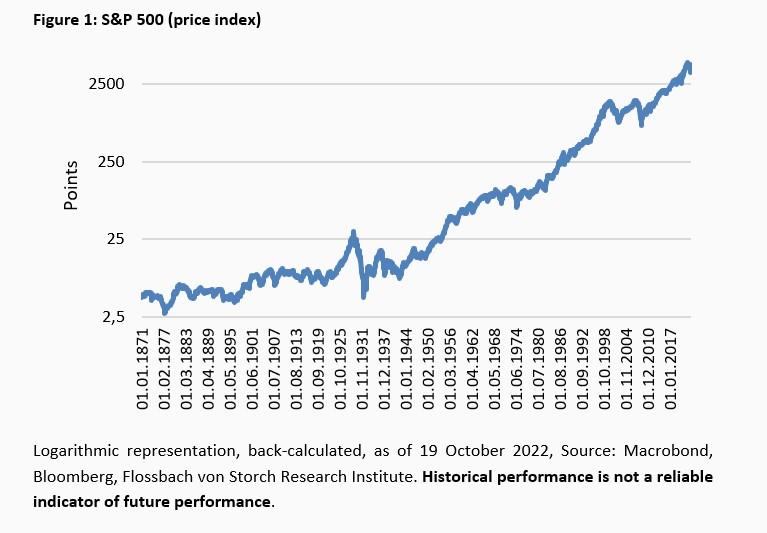
In October, the S&P 500 had thus reached almost three quarters of its historical median loss in bear markets. One third of the cumulative total loss was still missing its average bear market minus. In terms of average length, the S&P 500 is only a quarter of the way through the bear market since 1945.1 Possibly only a quarter: because bear markets can last a few weeks or even several years.
Since there is no certainty about the depth and duration of a bear market, investors inevitably have to make decisions for or against shares regardless. The decisive factor is the expectation of future returns. These can at least be approximated if investors use models that place return and risk components in a longer-term context.
The focus could initially be on classic valuation parameters such as the price-earnings ratio (P/E ratio) or the dividend yield. However, the depths can hardly be sounded out on this basis alone. In the seven bear markets since 1970, including the current downturn, the dividend yield at the low point averaged 3.4 per cent, and the price-earnings ratio 14.4 - these are not ratios that fall out of a usual valuation scheme for the S&P 500.
The range is wide: at the low point of the bear market in 1982, S&P 500 shares cost just over eight times annual earnings and yielded a dividend of just over six percent. By contrast, in the late summer of 2002, at the low point after the technology stock crash, S&P 500 stocks cost almost 22 times annual earnings with a rather meagre dividend yield of 1.9 per cent. Despite these widely divergent valuations, a bull market started in both 1982 and 2002.
Viewed over a good 30 years, since 1990, other valuation ratios at least give indications of when lows might have been reached. At the bottom, for example, there were regularly high returns on free cash flow, relatively low and below-average valuations of sales, book values and the ratio of enterprise value (defined as stock market value plus/minus net financial debt/liquidity) to earnings before interest, taxes, depreciation and amortisation of assets (Ebitda).
Currently, the S&P 500 has not yet reached such "bargain" valuations. However, there has not been a period since 1990 with inflation nearly as high as it is today and interest rates significantly lower than the price increase.
Answers to the question of what equities promise in terms of return for their higher risk compared to a very safe interest investment could serve as a stronger anchor.
This is because the profits companies are expected to generate are uncertain, unlike the interest rates on bonds with top credit ratings. Investors demand a premium for this uncertainty, known in the trade as a risk premium. This is measured in percentage points.
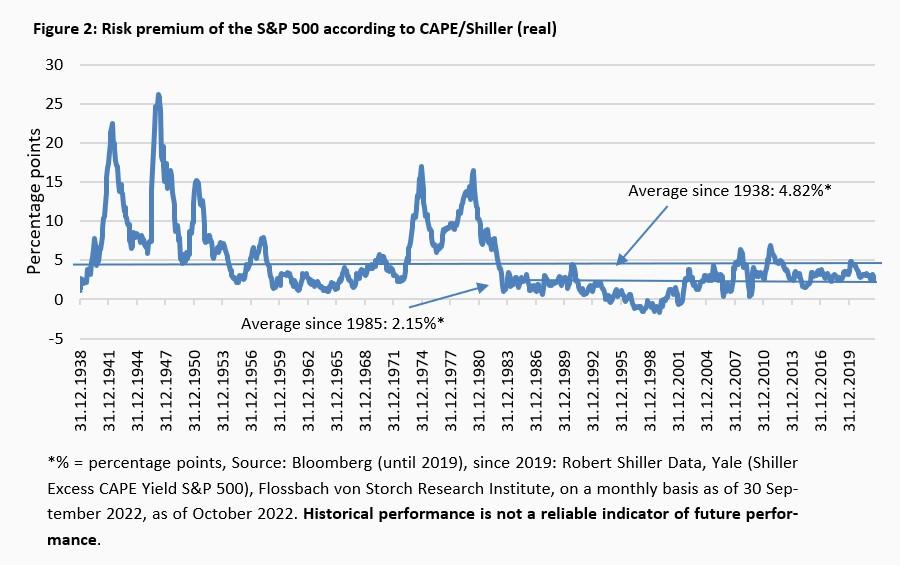
For example, insights can be gained from a cyclically adjusted price-to-earnings (P/E) ratio. Commonly known as CAPE, Shiller P/E or P/E 10, it is a valuation measure that is usually applied to the S&P 500.
The cyclically-adjusted price-to-earnings ratio developed by the famous Yale professor Robert Shiller is based on average, inflation-adjusted earnings over the previous ten years.
A yield calculated on this shows the risk premium that investors may assume for shares. The formula is: 1/CAPE minus the current real yield of ten-year US government bonds (calculated according to their nominal interest rate minus the change in US consumer prices, both in percent).
The risk premium calculated on this basis has averaged a good 4.8 percentage points for the S&P 500 since 1938 and 2.15 percentage points since the mid-1980s (Figure 2).
This equity risk premium is the difference between the equity return on the one hand and the so-called risk-free return on the other. A risk-free return is defined as the return on top-rated government bonds. For the US market, these are US Treasuries - to exclude exchange rate risks. Similarly, the interest rates for German Bunds or for Great Britain the domestic gilt yields are used.
However, there is no exact method for measuring the market risk premium. The results vary depending on the method and lead to different outcomes. Over very long periods of time, historical risk premiums have been four percentage points or higher.
For example, a study by the Humboldt University in Berlin on the markets in Germany, the USA, the UK, Switzerland and Australia, shows a risk premium for shares in the years 1900 to 2017 of four percentage points.2 The financial scientists Dimson, Marsh and Staunton ("The Triumph of the Optimists") calculated the global equity risk premium for the period from 1900 to 2019 at 4.4 percentage points. For this purpose, they use yields for short-term rather than long-term government bonds, which leads to a higher premium, as short-dated securities generally yield lower than long-dated ones.
However, investors in equities should be oriented towards the long term in order to survive the inevitable market fluctuations. Therefore, the deduction of the usually higher yields of longer-term securities with the best credit rating makes even more sense.
But even here, risk premiums result in the range already mentioned. For example, since 1990, a value of 4.3 percentage points is shown when the expected return of the S&P 500 minus the real yield of ten-year US government bonds (US Treasury nominal yield minus change in consumer prices) is considered (Figure 3).
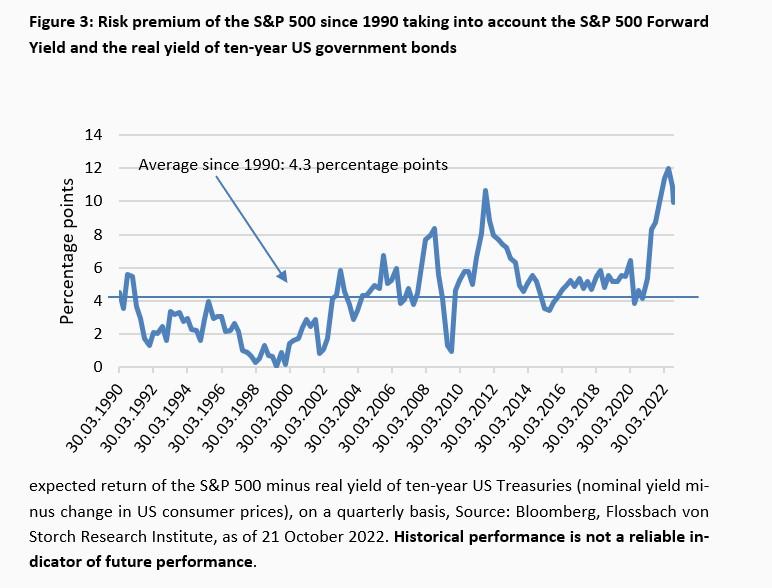
This year, an increase in the risk premium, which is to be understood as the hoped-for return above the risk-free interest rate, is evident in the clearly falling share prices. In addition to deeply negative real bond yields, the increase is related to the fact that on average there have been hardly any cuts in companies' profit expectations.
So far, this assumption has also survived the reality check, as the listed companies were even able to expand their margins on average in the course of the year.3 However, high risk premiums also reflect high uncertainty.
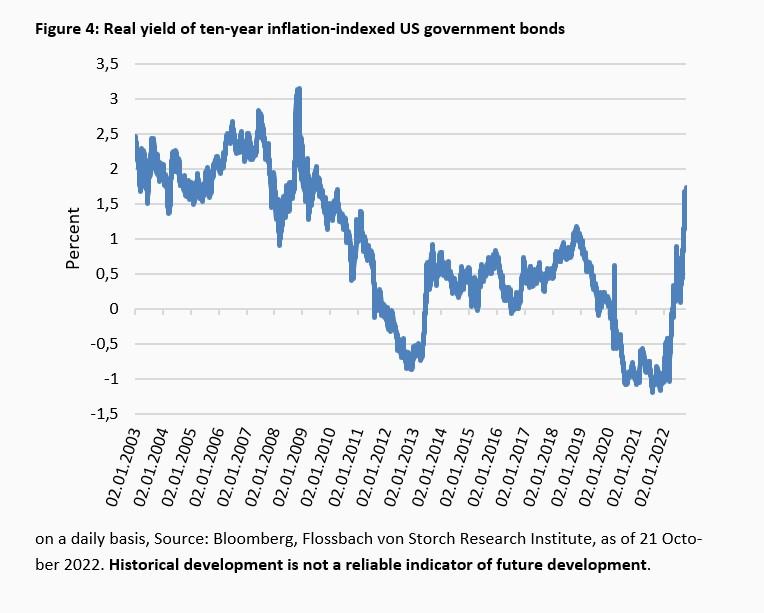
The risk-free interest rate is regularly referred to as the nominal interest rate on top-rated government bonds, from which investors can deduct general inflation. Alternatively, investors might consider real yields that inflation-indexed bonds yield.
This shows that these securities - again measured against ten-year US government bonds - are not only yielding a positive return for the first time in years, but at 1.7 percent per year they are also yielding more than at any time since the spring of 2010 (Figure 4).
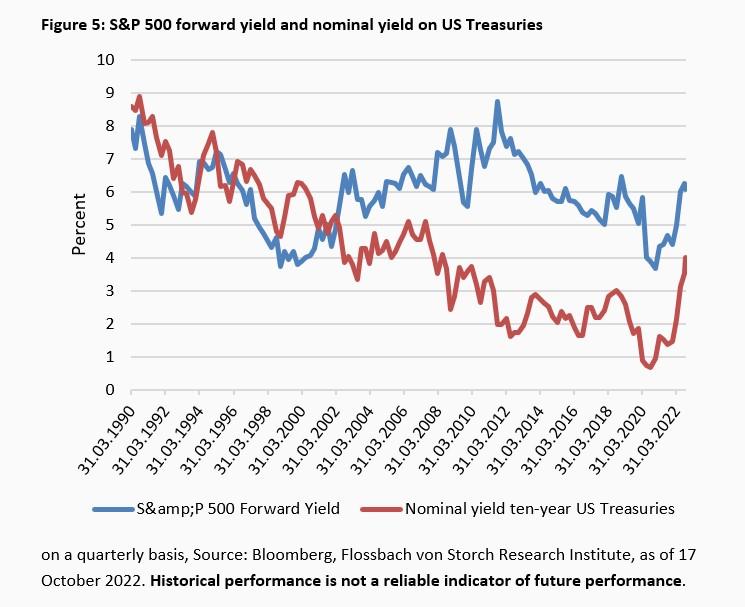
Not at all uncontroversial, but nevertheless helpful as an additional orientation, is the so-called "Fed model". At the end of the nineties of the 20th century, the then Deutsche Morgan Grenfell analyst Ed Yardeni coined this name after he became aware that the then acting chairman of the US Federal Reserve Alan Greenspan was using the expected earnings yield of the S&P 500 and the nominal yield of ten-year US government bonds to assess the valuation of the stock market.
A strong argument for this model is that equities and bonds are the two main competing liquid asset classes. The value of equities as the sum of their discounted future cash flows competes with the safe income from government bonds, measured by their yield.
Even though the nominal yield on ten-year US Treasuries has risen significantly recently, the original Fed model continues to signal a lead for equities. This was different, for example, at the turn of the millennium, when safe bonds promised a higher yield than the comparatively uncertain equity yield (Figure 5).
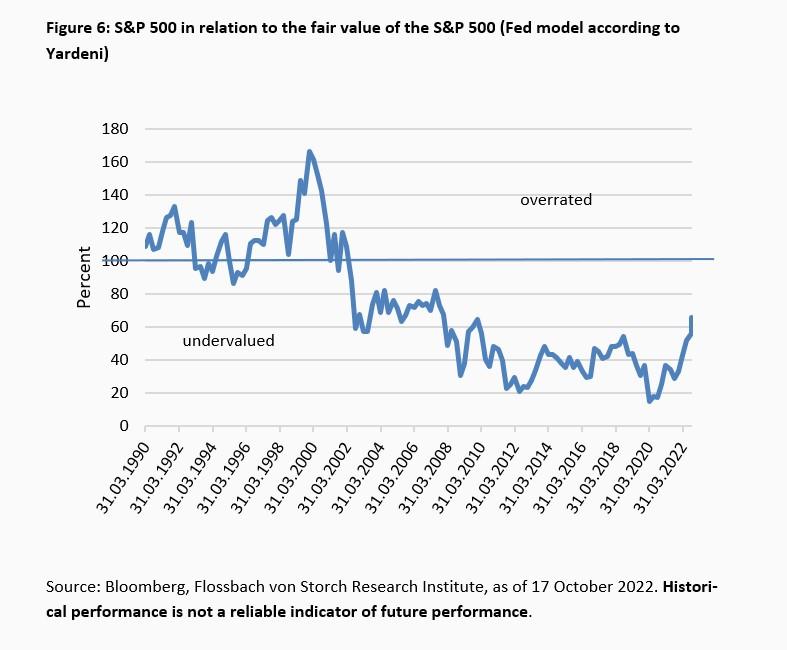
Yardeni made modifications based on the original Fed model. Among other things, he modelled another comparison to determine whether equities are more worthwhile than bonds. To do this, he set the S&P 500 in relation to the S&P 500 fair value price. The latter is defined as the S&P 500 twelve-month consensus earnings forecast divided by the ten-year nominal yield of US government bonds.
In further developing his Fed model, Yardeni had found that the ratio of the S&P 500 to its expected earnings was strongly correlated with the inverse of the yield on ten-year bonds. Here, too, it is currently apparent that although equities are losing ground, they would still be undervalued according to this model - and significantly so (Figure 6).
Depending on the model and the parameters applied in each case, different results emerge. However, it can be stated that despite the rise in nominal interest rates, the scales continue to tip in favour of investing in equities - sometimes more, sometimes less clearly, but overall without doubt.
Whether shares are currently very cheap and the bottom of the bear market has been reached cannot be determined by the risk premium alone or by other ratios such as the P/E ratio. However, the results may serve strategic investors as an indication that shares are to be preferred in relation to bonds.
This assessment could be undermined by a noticeable decline in the profits of listed companies while at the same time real interest rates remain at least constant, even if they remain negative.
If a permanent positive real interest rate level (interest rate minus inflation) were to materialise, this would undoubtedly strengthen an investment in bonds and weaken the stock market, unless corporate profits were to rise above the currently assumed future level. In reality, however, a positive real interest rate level is further away than ever.
1https://www.flossbachvonstorch-researchinstitute.com/de/studien/der-20-baerenmarkt/
3https://www.flossbachvonstorch-researchinstitute.com/de/studien/im-schatten-der-inflation/


Legal notice
The information contained and opinions expressed in this document reflect the views of the author at the time of publication and are subject to change without prior notice. Forward-looking statements reflect the judgement and future expectations of the author. The opinions and expectations found in this document may differ from estimations found in other documents of Flossbach von Storch AG. The above information is provided for informational purposes only and without any obligation, whether contractual or otherwise. This document does not constitute an offer to sell, purchase or subscribe to securities or other assets. The information and estimates contained herein do not constitute investment advice or any other form of recommendation. All information has been compiled with care. However, no guarantee is given as to the accuracy and completeness of information and no liability is accepted. Past performance is not a reliable indicator of future performance. All authorial rights and other rights, titles and claims (including copyrights, brands, patents, intellectual property rights and other rights) to, for and from all the information in this publication are subject, without restriction, to the applicable provisions and property rights of the registered owners. You do not acquire any rights to the contents. Copyright for contents created and published by Flossbach von Storch AG remains solely with Flossbach von Storch AG. Such content may not be reproduced or used in full or in part without the written approval of Flossbach von Storch AG.
Reprinting or making the content publicly available – in particular by including it in third-party websites – together with reproduction on data storage devices of any kind requires the prior written consent of Flossbach von Storch AG.
© 2024 Flossbach von Storch. All rights reserved.